Why sovereign debt composition matters
Academic, policy, and market interest in sovereign debt has spiked since the 2008 Global Crisis. Researchers have sought to place the post-Crisis synchronised build-up in sovereign debt ratios in advanced economies within a longer-term/historical context, drawing comparisons with debt surges during the Great Depression, debt consolidations in the aftermath of World War II, and more.1
However, this literature has largely abstracted from a discussion of sovereign debt ‘composition’, which, both theory and experience tell us, is central to questions of debt sustainability/management, optimal taxation, monetary policy, and even financial regulation.2 For instance, an inability to issue term debt in local currency is often described as ‘original sin’ (Eichengreen and Hausmann 2002, Eichengreen et al. 2003), which drives the high cost/riskiness of (higher yields on) emerging-market sovereign debt. Arslanalp and Tsuda (2012) have linked the holder profile of sovereign debt to countries’ ability to weather financial market stress. Reinhart and Sbrancia (2011) highlight the amenability of non-marketable debt to ‘liquidation’ during periods of financial repression. The recent wave of European sovereign debt crises has underscored the importance of debt maturity – countries with longer debt duration registered lower sovereign risk premia than others, despite higher debt and deficit levels (Abbas et al. 2014a).
The biggest obstacle to a proper historical treatment of sovereign debt composition, in our view, has been a lack of data. Debt structure data are simply not available in an easily accessible format across countries over long stretches of time. Our recent paper (Abbas et al. 2014c) seeks to address this data gap. Using official sources for individual countries – as well as some published cross-country datasets – we assemble a debt structure database spanning the period 1900–2011 and 13 advanced economies: Australia, Austria, Belgium, Canada, France, Germany, Ireland, Italy, the Netherlands, Spain, Sweden, the UK, and the US.
The dataset slices the sovereign debt pie along four dimensions: currency (foreign vs. local); maturity (local currency debt subdivided into short-term and medium-to-long-term); marketability; and holders (non-residents, national central bank, domestic commercial banks, and the rest). Because this is a first effort, we still report a number of gaps in our data, which reflect, in most cases, the lack of coverage on certain categories of debt (such as debt held by non-residents) or during certain stress periods (such as around the World Wars). Notwithstanding the gaps, the dataset offers insights into the evolution of debt structure over the past 11 decades, including around major sovereign stress events.
What the historical debt structure data reveal
A bird’s eye view of key debt composition ratios over time offers some intuitive patterns.
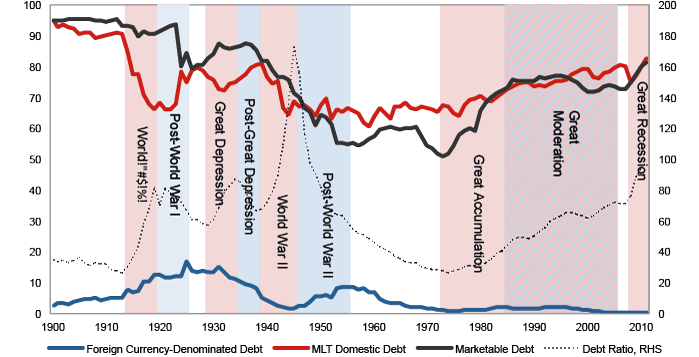
Around 90% of advanced economies’ debt is and was denominated in local currency. Still, six of the 13 countries saw the foreign currency debt share rise above 50% at some point – post-WWI France and Italy are notable cases in point.
The share of local currency medium-to-long-term debt in total debt has averaged 68% over the sample (or three-fourths of local currency debt) and exhibits an intuitive pattern – governments issued longer-dated paper in good times and compensated for the higher riskiness of their debts during bad times by shortening issuance maturities. Cross-country variation in the maturity structure of debt mirrors differences in, inter alia, a country’s vulnerability to fiscal/military crises, reserve currency status, and debt management preferences.
Before WWI, almost all central government debt was issued in the form of marketable securities. The share of such securities declined during post-WWI consolidations, before falling precipitously (to as low as around 55%) during and after WWII – an era characterised by financial repression and captive financial markets. The share recovered starting in the mid-1970s and now stands at about 80%.
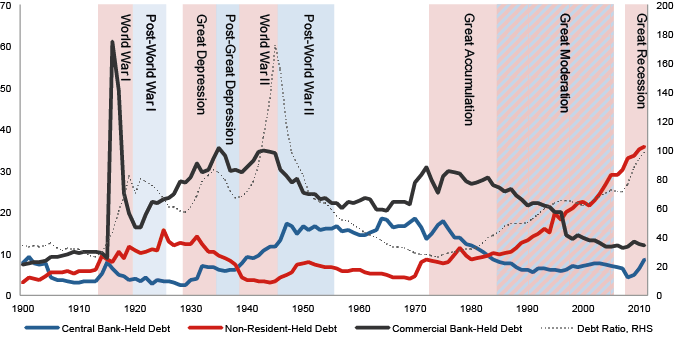
The holder profile data reveals an average share in debt for national central banks of about 10%,3 and almost double that for domestic commercial banks. Moreover, the two shares appear to be substitutes for much of the 1920–1970 period – central banks were clearly picking up the tab from commercial banks (and other holders) around/after WWII. Both shares fell in tandem after the 1970s, as just non-resident participation in sovereign debt markets soared. The non-residents’ share of debt increased from 5% to 35% over 1970–2011, and reflected a number of underlying factors: financial innovation and globalisation; stronger sovereign debt management; independent central banks committed to low inflation; the introduction of the euro, which led to the de facto elimination of currency risk within the Eurozone; and the accumulation of ‘safe’ foreign sovereign securities by emerging Asian economies, especially China.
Figure 1. Central government debt composition by instrument and currency
Figure 2. Holder composition of central government debt
Source: Authors’ calculations.
We also provide a more ground-level view of how debt composition of individual sovereigns responded to major episodes of debt accumulation and consolidations during 1900–2011. We recover some broad common patterns.
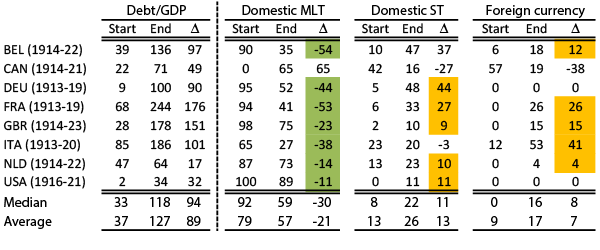
Large debt accumulations – essentially, large increases in debt supply – were typically absorbed by increases in short-term, foreign currency-denominated and banking-system-held debt (Table 1 provides an illustration from WWI).
Table 1. World War I: Maturity and currency (% of GDP for debt/GDP; otherwise, % of central government debt)
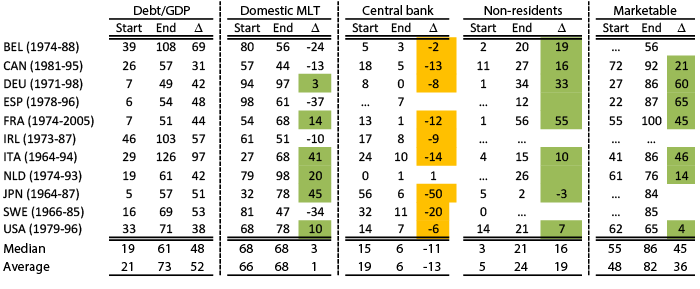
This pattern, however, did not hold during the debt build-ups starting in the 1980s and 1990s, which were compositionally skewed toward long-term local-currency marketable debt (see Table 2 below). We attribute this change to similar factors to those that drove higher non-resident demand for sovereign paper. These include the emergence of a large (global) contractual savings sector with long investment horizons, and independent central banks committed to low inflation, thus providing confidence that governments would not inflate away the burden of long-term nominal debt obligations.
Table 2. The Great Accumulation: Maturity, holders, and marketability (% of GDP for debt/GDP; otherwise, % of central government debt)
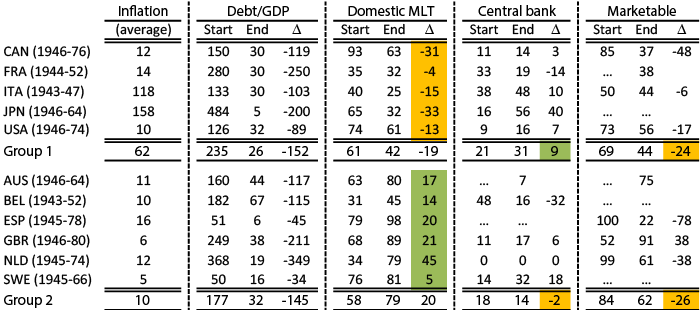
On debt consolidations, we find support for the financial repression-cum-inflation channel during the post-WWII episodes, but are also able to show that this channel did not operate with the same intensity everywhere. Table 3 shows two country groups, categorised according to whether debt maturities lengthened or shortened during the consolidations (debt maturity is used here as a proxy for voluntary investor demand). In the first group, where maturities shortened, resort to central bank financing and inflation was higher, and the debt ratio fell by an average of 152% of GDP. In the second group, where maturities lengthened, the debt reduction was only slightly more modest (145% of GDP), but inflation and central bank financing involvement were much more modest.
Table 3. Post-World War II consolidation: Maturity, holders, and marketability (% of GDP for debt/GDP; otherwise, % of central government debt)
What it means for debt reduction ahead
The foregoing suggests that governments have pursued two broad types of debt reduction strategies in the past: a traditional approach committed to preserving long debt durations, accompanied by fiscal consolidation and, in some cases, moderate inflation (although moderate in earlier decades would be considered high today); and an unconventional strategy that involved reliance on debt holdings (often non-marketable) by fully- or semi-captive domestic investors, accompanied by very high inflation, and at the cost of shortening debt maturities. Given the current environment of low growth and politically challenging fiscal adjustments, it bears asking if the unconventional strategy is feasible.
Table 4. Sovereign debt composition, past and present (% of GDP for debt/GDP; otherwise, % of central government debt)
In our own view (not to be mistaken with the view of the IMF), the pre-requisites for pursuing such a strategy – e.g. absence of capital controls, lack of competing investment opportunities – are not met. With 36% of the advanced economy debt now held by non-residents (compared with 3% at end-WWII), and only 21% held by the domestic banking system (compared with 46% at end-WWII), sustaining involuntary demand for sovereign debt offering sub-market returns will be difficult (Table 4).
Similarly, recourse to surprise inflation (with or without financial repression) above conservative central bank inflation targets to dent the value of already-issued medium-to-long-term securities will likely present challenges: (i) the current ‘lowflation’ environment in many advanced economies renders engineering significant inflation surprises challenging; (ii) the globally-accepted regime of price stability (as the anchor for monetary policy) does not quite allow for surprise inflation; (iii) the latter could entail significant economic costs, as governments would either have to accept permanently higher inflation with direct costs to efficiency and investment, or, if they wished to return to low inflation, accept the inevitably painful disinflation process (e.g. Fischer 1994, Bordo and Orphanides 2013); and (iv) higher inflation would likely entail a permanent hidden ‘cost’ in terms of departure from a less risky (long-duration) debt structure, or a lower level of sustainable debt (Aguiar et al. 2014).
What it means for further analytical work on sovereign debt
Further work is needed to develop models that can deal with the observed ‘shifts’ in sovereign debt management objectives over time that our debt composition data capture. For instance, until WWI, sovereign debt management was geared to debt issuance for specific and temporary purposes, such as to finance a war. After WWII, the focus shifted to reducing the debt-to-GDP ratio, including through financial repression and inflation policies. And in recent decades, debt management objectives have been largely cast in terms of minimising expected debt servicing costs, subject to an acceptable level of refinancing risk, which translated into a shift towards longer-term debt denominated in local currency held by a diversified investor base.
More work is also needed on how and whether debt structure can help predict crises. An initial analysis based on the paper’s data suggests that changes in the debt composition typically considered to increase exposure to crisis risk, such as maturity shortening, indeed could have these consequences. Similarly, governments’ willingness to default (outright) on their debt may be different if much of the debt were held by non-residents as opposed to domestic investors (especially banks).
Disclaimer: The views expressed herein are those of the authors and should not be attributed to the IMF, its Executive Board, or its management.
References
Abbas, S M A, N Belhocine, A El-Ganainy, and M Horton (2011), “Historical Patterns and Dynamics of Public Debt – Evidence From a New Database”, IMF Economic Review 59(4): 717–742.
Abbas, S M A, N Arnold, M De Broeck, L Forni, and M Guerguil (2014a), “The Other Crisis: Sovereign Distress in the Euro Area”, in C Cottarelli, P Gerson, and A Senhadji (eds.), Post-Crisis Fiscal Policy, Cambridge, MA: MIT Press: 193–226.
Abbas, S M A, N Belhocine, A El-Ganainy, and A Weber (2014b), “Current Crisis in Historical Perspective”, in C Cottarelli, P Gerson, and A Senhadji (eds.), Post-Crisis Fiscal Policy, Cambridge, MA: MIT Press: 161–191.
Abbas, S M A, L Blattner, M De Broeck, A El-Ganainy, and M Hu (2014c), “Sovereign Debt Composition in Advanced Economies: A Historical Perspective”, IMF Working Paper 14/162.
Arslanalp, S and T Tsuda (2012), “Tracking Global Demand for Advanced Economy Sovereign Debt”, IMF Working Paper 12/284.
Aguiar, M, M Amador, E Farhi, and G Gopinath (2014), “Sovereign Debt Booms in Monetary Unions”, American Economic Review, forthcoming.
Bordo, M and A Orphanides (eds.) (2013), The Great Inflation: The Rebirth of Modern Central Banking, Chicago: University of Chicago Press.
Eichengreen, B, R Hausmann, and U Panizza (2003), “Currency Mismatches, Debt Intolerance and Original Sin: Why They Are Not the Same and Why it Matters”, NBER Working Paper 10036.
Eichengreen, B and R Hausmann (eds.) (2002), Debt Denomination and Financial Instability in Emerging Market Economies, Chicago: University of Chicago Press.
Fischer, S (1994), “The costs and benefits of disinflation”, in J O de Beaufort Wijnholds, S Eijffinger, and L Hoogduin (eds.), A Framework for Monetary Stability, Dordrecht: Kluwer Academic Publishers.
Reinhart, C and K Rogoff (2009), This Time is Different: Eight Centuries of Financial Folly, Princeton: Princeton University Press.
Reinhart, C and K Rogoff (2013), “Financial and Sovereign Debt Crises”, IMF Working Paper 13/266.
Reinhart, C and B Sbrancia (2011), “The Liquidation of Government Debt”, NBER Working Paper 16893.
Sbrancia, B (2011), “Debt and Inflation during a Period of Financial Repression”, Job Market Paper, Department of Economics, University of Maryland College Park.
Footnotes
1. See, for example, Reinhart and Rogoff (2009, 2013), Sbrancia (2011), Reinhart and Sbrancia (2011), Abbas et al. (2011), and Abbas et al. (2014b).
2. Notable exceptions are Sbrancia (2011) and Reinhart and Sbrancia (2011), who look at debt maturity and marketability structure for 12 economies (a mix of emerging and advanced) over 1948–1980. However, this dataset is not yet public.
3. As a share of GDP, central bank holdings averaged about 5%, with a peak of 19% during WWII and a recent post-Crisis uptick reflecting large-scale asset purchase programs (as in the UK and the US).


