Estimates of firm-level mark-ups by De Loecker and Eeckhout (2017), Gutierrez and Philippon (2016), and Gutierrez (2017) show that the average mark-ups in the US economy have been increasing over the last 20 years. This growth in mark-ups has coincided with a slowdown of productivity growth. Are these two trends related, and if so, what are the implications of the secular evolution of mark-ups for productivity?
Loosely speaking, aggregate productivity growth measures how much faster output (GDP) is growing relative to the growth in inputs (labour and capital). The business of separating aggregate productivity from input growth is called growth accounting.
Traditionally, growth accounting assumes that the economy is perfectly competitive, with no monopoly rents, mark-ups, or other distortions. Under these assumptions, foundational results by Solow (1957) and Hulten (1978) show that aggregate productivity growth is a combination of the technological productivity growth rates of the firms in the economy.
It has long been understood that if the economy is not perfectly competitive, then aggregate (or macro) productivity can change for reasons unrelated to technological (or micro) productivity. Intuitively, if the economy is not perfectly competitive, then workers, capital, and intermediate goods are not optimally allocated. Over and above changes in firms’ technologies, changes in allocative efficiency also contribute to aggregate productivity growth.
In a recent paper (Baqaee and Farhi 2017), we generalise growth accounting beyond the perfectly competitive case, and show how changes in aggregate productivity can be decomposed into two structurally interpretable components: changes in firms’ technological productivities, and changes in allocative efficiency. We use this framework to assess the implications of secular changes in mark-ups for aggregate productivity.
To conduct our analysis, we use three different measures of mark-ups computed at the firm-level for the US economy using Compustat: the mark-up series of De Loecker and Eeckhout (2017), Gutierrez and Philippon (2016), as well as mark-ups implied by the operating profit margin (often times called the Lerner index). All three series show that the average mark-up has been increasing over the last 20 years, and that this increase is happening for all industries. Importantly, all three series show that within industries, the increase in the average mark-up is primarily due to a composition effect across firms rather than a within-firm effect: mark-ups have increased because high-mark-up firms have increased their relative size, not because firms have increased their mark-ups.1
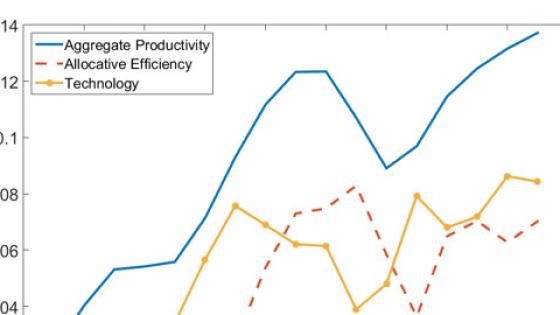
Our results, displayed in Figure 1 for the Gutierez-Philipon (2016) mark-ups, show that this reallocation of market share from low- to high-mark-up firms has considerably improved the allocative efficiency of the US economy over the last 20 years. In fact, improvements in allocative efficiency account for about 50% of the cumulated growth in aggregate productivity during this period. This suggests that ‘true’ technological productivity growth has been even slower than previously imagined.2
To understand this surprising result, it is important to recognise how mark-ups affect productivity. Mark-ups increase firms’ prices and reduces their production. A high average mark-up reduces output and depresses the demand for labour and capital, generating low aggregate employment and low aggregate investment. It reduces the aggregate labour and capital shares, and increases the aggregate profit share. In fact, increasing average mark-ups have been proposed as an important cause for the declining participation rate, the slow recovery, the weakness of investment, the decline in interest rates, and the declining labour share in the US economy.3
However, the level of average mark-up does not, by itself, affect aggregate productivity. Instead, aggregate productivity depends on the heterogeneity of mark-ups across firms. From a social perspective, low-mark-up firms are too large and high-mark-up firms are too small. This inefficiency in the allocation of resources across firms reduces aggregate productivity.
This observation, together with the fact that the secular increase in average mark-ups is driven by a composition effect whereby high-mark-up firms have increased their relative size, contains the key intuition behind the associated improvement in allocative efficiency. These high-mark-up firms were too small to begin with, and so the fact that they have gotten relatively larger, and therefore that resources have been reallocated towards them, has improved the overall efficiency of the economy.
Figure 1 Decomposition of aggregate productivity growth into technology and allocative efficiency, using the Gutierrez and Philippon (2016) mark-up data
The improvement in allocative efficiency is intimately related to the secular decline in the labour share. Surprisingly, all else equal, a decrease in the labour share of income is associated with an increase in allocative efficiency.
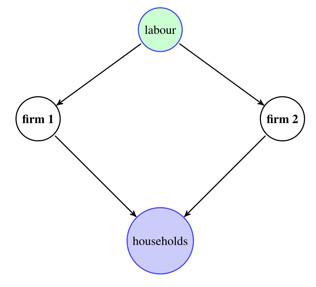
To see why, consider the simple example of an economy depicted in Figure 2, with two firms producing two different goods using labour. Suppose that Firm 1 is charging a higher mark-up relative to Firm 2. This dispersion in mark-ups is inefficient and reduces aggregate productivity: Firm 1 is too small relative to Firm 2 because it is charging a higher mark-up. Now suppose that Firm 1 becomes more productive and hence reduces its price. If the two firms are producing substitute goods, then the market share and employment share of Firm 1 will increase, and those of Firm 2 will decrease. This reallocation of resources away from the too-large Firm 2 and towards the too-small Firm 1 improves allocative efficiency. In this simple example, the change in allocative efficiency can be measured by the decrease in the aggregate labour share and the increase in the aggregate profit share. The labour share decreases, and the profit share increases, because resources are reallocated to Firm 1, which has a high profit share and a low labour share, and away from Firm 2, which has a low profit share and a high labour share. It turns out that this simple intuition can be extended to a much more general environment, with many firms, many factors of production, and changing mark-ups.
The positive contribution of allocative efficiency to aggregate productivity growth in the US over the last 20 years does not tell us anything about the overall efficiency costs of mark-ups. One way to see this is to ask the following question: By how much would we expect aggregate productivity to increase if we eliminated mark-ups? To answer this question, we calibrate a firm-level model of the US economy, matching the distribution of mark-ups, the network structure of inter-industry trade, and the evidence on substitution elasticities. We find that eliminating mark-ups would raise aggregate productivity by around 40%.
Figure 2 Simple example of an economy with two firms discussed in the text
Note: The arrows show the flow of inputs.
These gains must be contrasted with the influential estimates of Harberger (1954), who concluded that the losses caused by monopolies in the US economy were on the order of 0.1% of aggregate productivity. Harberger’s results had a profound impact on macroeconomics, and it provided an argument for emphasising Keynesian aggregate demand inefficiencies in comparison with microeconomic distortions. It famously led Tobin (1977) to quip that “it takes a heap of Harberger triangles to fill an Okun gap”. Our results strongly challenge this received wisdom. The main reason why we find higher efficiency costs of mark-ups is that we use firm-level data, whereas Harberger used sectoral-level data, and that there is more dispersion in mark-ups and more substitutability at the firm level than at the sectoral level.
Of course, these results only capture the static costs of mark-ups, taking the level of technology as given. This is legitimate if mark-ups represent pure monopoly rents. But in practice, mark-ups may have benefits by rewarding investments in innovation and entry. Our calculations measure the immediate static costs of mark-ups, but are silent on their potential dynamic long-run benefits.
Perhaps even more surprisingly, in light of the conclusion that allocative efficiency has positively contributed to aggregate productivity growth over the last 20 years, we find that the gains from eliminating mark-ups have increased over time. Eliminating mark-ups in 1997 would have only raised aggregate productivity by around 5%-20%.
There is no contradiction here. The gains from eliminating mark-ups measure the distance of the economy from its theoretical efficient frontier. Essentially, this distance has increased because the dispersion of mark-ups has increased. Instead changes in allocative efficiency have contributed positively to aggregate productivity because there has been a reallocation of resources to high mark-up firms. These two phenomena have taken place together over the last 20 years.
Analysing the impact of mark-ups on aggregate productivity is subtle, and one cannot draw conclusions purely from aggregate trends. Assessing the impact of mark-ups requires a theory of aggregation that allows the aggregation of microeconomic information up to macroeconomic aggregates. We provide a general flexible theoretical framework for performing this aggregation, not only with mark-ups, but with arbitrary microeconomic inefficiencies more generally, such as reallocation frictions in factor markets, credit constraints, nominal rigidities, etc.
References
Autor, D, DF Dorn, L Katz, C Patterson and J Van Reenen (2017), “The Fall of the Labor Share and the Rise of Superstar Firms”, CEP Discussion Paper No. 1482.
Baqaee, D and E Farhi (2017), “Productivity and Misallocation in General Equilibrium”, NBER Working Paper No. 24007.
De Loecker, J and J Eeckhout (2017), “The Rise of Market Power and the Macroeconomic Implications”, NBER Working Paper No. 23687.
Gutiérrez, G and T Philippon (2016), “Investment-less growth: An empirical investigation”, NBER Working Paper No. 22897.
Gutiérrez, G (2017), “Investigating Global Labour and Profit Shares”, NYU Working Paper.
Hall, Robert E. (1990), Chapter 5 in Growth/Productivity/Unemployment: Essays to Celebrate Bob Solow’s Birthday, MIT Press, pp. 71-112.
Harberger, A C (1954), “The Welfare Loss from Monopoly”, American Economic Review 44(2).
Hulten, C R (1978) “Growth accounting with intermediate inputs”, The Review of Economic Studies 45(3): 511-518.
Solow, R M (1957), “Technical change and the aggregate production function”, The Review of Economics and Statistics 39(3).
Kehrig, M, and N Vincent (2017), “Growing Productivity without Growing Wages: The Micro-Level Anatomy of the Aggregate Labour Share Decline," Duke Working Paper.
Tobin, J (1977), “How dead is Keynes?”, Economic Inquiry 15(4):459–468.
Endnotes
[1] Our finding that average mark-ups have been rising due to a composition effect across firms is also consistent with the work of Kehrig and Vincent (2017) and Autor et al. (2017) who find that firms with lower total wage bills as a share of their revenues have been expanding their market shares.
[2] The decomposition also features a “factor undercounting term”, reflecting the fact that in aggregate productivity as measured by the Solow residual, the growth of a factor is inappropriately weighted by its share in value added, as first emphasized by Hall (1990). The contribution of this term to the growth of the Solow residual is negative for all markup measures. It is negligible for the mark-ups of Gutierrez_and Philippon (2016), but larger for the Lerner index mark-ups and for the De Loecker and Eechout (2017) mark-ups.
[3] For example, De Loecker and Eeckhout (2017), Gutierrez and Philippon (2017), Gutierrez (2017), amongst others.


