How does inequality in today’s least developed, agricultural countries compare with that of ancient societies dating back to the Roman Empire? Did some parts of the world always have greater income inequality than others? Was inequality augmented by colonization? Did the industrial revolution lower inequality or raise it?
Recent research infers inequality for 14 ancient societies using what are known as social tables.1 It also applies two new concepts in making those assessments – the inequality possibility frontier and the inequality extraction ratio. Rather than just offering measures of actual inequality, we compare the latter with the maximum feasible inequality (or surplus) that could have been extracted by the elite. We suggest five working hypotheses about inequality patterns over the very long run. First, income inequality rose initially as hunter-gatherer settlements slowly evolved into agricultural societies with rising surpluses above subsistence. Second, there is little difference in conventionally measured inequality between modern and ancient pre-industrial societies. Third, the elites in ancient societies failed to exploit their opportunities fully, since income inequality did not rise anywhere near as much as it could have. Fourth, inequality in ancient societies was driven largely by the class-average gap between the rural poor at the bottom and the landed or bureaucratic elite at the top. The distribution of income among the elite themselves, and their share in total income, contributed far less to overall inequality, and never consistently. Fifth, ancient inequality probably was lower in East Asia than it was elsewhere, suggesting long period-persistence in region-specific distributions.
While there is little difference in conventionally measured inequality between modern and ancient pre-industrial societies, there are immense differences between what was possible and what was achieved. New measures are needed to explore this issue, and the inequality possibility frontier is one. Suppose that each society has to distribute income in such a way as to guarantee subsistence minimum for its poorer classes. The remainder is the surplus that accrues to the elite. When average incomes are very low, the surplus is small, and inequality is modest. As average incomes increase with economic progress, the surplus increases, and the maximum possible inequality rises. Whether the elite fully exploit that maximum, or whether there is some trickle-down to the poorest classes, is another matter entirely. Figure 1 plots inequality (using the Gini index) against GDI per capita. The figure also displays two inequality possibility frontiers. The first is constructed using Angus Maddison’s assumption of a subsistence minimum of $PPP 400 (solid line) compared to which four ancient societies are significantly more unequal than the maximum Gini implied by the frontier: three of these are from India, and the fourth is from Nueva España. Following a suggestion by Colin Clark, the second frontier (dotted line) is drawn under the subsistence = $PPP300 assumption, shifting the frontier upwards far enough to encompass at or below it all our estimated inequalities.2
Figure 1: Ancient Inequalities: Gini Coefficients, and Two Inequality Possibility Frontiers
Note: The solid IPF line is constructed assuming a subsistence (s)=$PPP400; the broken-line IPF is constructed assuming s=$PPP 300. Inequality is measured using the Gini index.
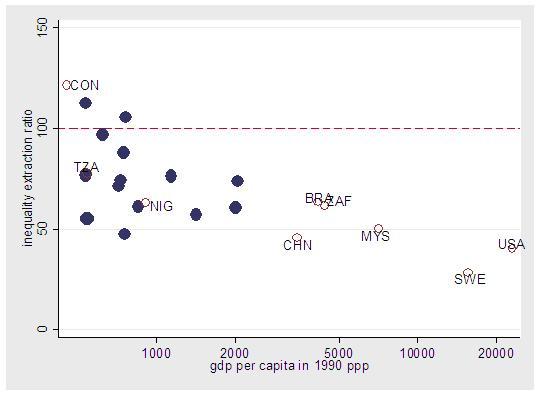
How does actual ancient inequality compare with maximum feasible inequality? Call the ratio between the two the inequality extraction ratio, indicating how much of the maximum inequality was actually extracted. The median ratio in the ancient sample is 94% -- a huge share of the surplus was actually extracted by the elite. In contrast, China’s present inequality extraction ratio is 47 percent, while that for the United States and Sweden are only 41 and 28 percent, respectively. Only in today’s extremely poor countries do actual and maximum feasible inequality lie close together (2003 Nigeria, 2004 Congo D. R., and 2000 Tanzania). Thus, while conventionally-measured ancient inequalities are equivalent to that of today’s pre-industrial societies, ancient inequality extraction ratios were much greater. Figure 2 plots the inequality extraction ratio for both ancient and modern societies, and it traces out a long run decline, which was especially steep up to the industrial revolution in Western Europe around 1800.
Figure 2: Inequality Extraction Ratio for the Ancient Society Sample and Selected Modern Societies
Note: Modern societies are drawn with hollow circles, ancient filled in black. Horizontal axis in logs. Inequality possibility frontier based on the subsistence minimum of $PPP300.
This new measure of inequality may capture our notions of inequality more accurately than any actual measure. For example, Tanzania (denoted TZA in Figure 2) with a relatively low Gini of 35 may be less egalitarian than it appears since it has a high extraction ratio. On the other hand, Malaysia (MYS) may have a much higher Gini (almost 48), but its elite have extracted only about one-half of maximum feasible inequality.
Another implication of this approach is that it considers jointly inequality and development. As a country becomes richer, its feasible inequality expands. Consequently, if recorded inequality is stable, the inequality extraction ratio must fall; and even if recorded inequality goes up, the ratio may not. Thus, the social consequences of increasing inequality under conditions of economic growth may not entail as much relative impoverishment or perceived injustice as the recorded Gini might suggest. This logic is particularly compelling for poor and middle-income countries where economic growth pushes up the maximum feasible inequality sharply. This rise in maximum feasible inequality tapers off later, as a society’s average income rises farther above subsistence, so that the inequality extraction ratio will be driven more and more by movements in the Gini itself.
How much of the inequality observed in ancient societies can be explained by the economic distance between the rural landless poor at the bottom and the rich landed or bureaucratic elite at the top? Alternatively, how much can be explained by the distribution among the elite at the top and by their share in the total?
An impressive amount of recent empirical work finds that large swings in the share of income captured by those at the top of the income pyramid for over a dozen countries.3 Given that motivation, the paper asks whether differences in the share of the top 1 percent might also be a good proxy for differences in overall income distribution in ancient pre-industrial societies. The answer seems to be no. That is, differences in the top one-percent share do not serve as a good proxy for the overall Gini.
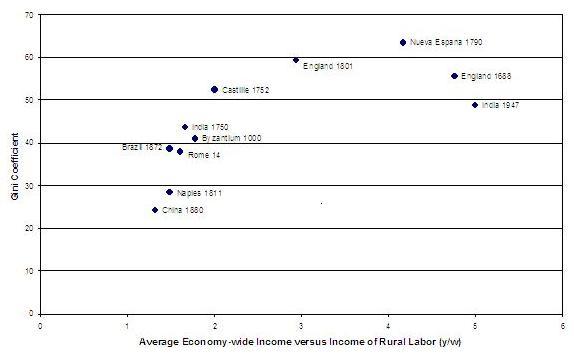
Given the scarcity of full income distributions from before 1960, it would be very helpful if one could rank different societies’ income inequalities according to some more frequently available proxy. Such a proxy is the economic distance between the landed elite and landless labour, or the ratio of average family income (y) to that of an unskilled rural labourer (w). Figure 3 plots the relation between the overall Gini and the y/w ratio. The correlation is positive and significant, and the estimated relationship implies that for every 10 percent increase in y/w, the Gini rose by 4 percentage points. Low measured inequalities in China 1880 and Naples 1811 were consistent with small gaps between poor rural labourers and average incomes, or with a rural wage two-thirds to three-quarters of average income. High measured inequalities in Nueva España 1784-99 and England 1801-03 were consistent with large gaps between poor rural labourers and average incomes, or with a rural wage only one-quarter to one-third of average income. Typically, therefore, the gap between poor landless labor and those with average income drove the Gini, not conditions at the top.
Figure 3: Gini vs the y/w Ratio in an Ancient Sample of Eleven
Conclusions
Some key aspects of inequality have been uncovered by this initial look at ancient societies.4 On the average, income inequality in today’s countries is not very different than it was in distant times. However, the extraction ratio – how much of potential inequality was converted into actual inequality – was significantly bigger then than now. This ratio measures how powerful and extortionary are the elite, its institutions, and its policies. While a relation between conflict and actual inequality has proven hard to document on modern evidence, the introduction of the extraction ratio might shed brighter light on that conjecture. It might also show more clearly how colonisers exploit the colonised: indeed, some preliminary ancient inequality evidence suggests higher extraction ratios in colonised s than in autonomous societies. Unlike the findings regarding the evolution of the 20th century inequality in advanced economies, our ancient inequality sample does not reveal any significant correlation between the income share of the top 1 percent and overall inequality. Instead, it was the gap between the working poor at the bottom and those near the top that mattered.
Footnotes
1 This commentary is based on “Measuring Ancient Inequality,” NBER Working Paper 13550.
2 Maddison, Angus (2004), World Population, GDP and Per Capita GDP, 1-2001 AD; Clark, Colin (1957), The Conditions of Economic Progress, London: Macmillan and Co.
3 Thomas Piketty and Emmanuel Saez. 2006. “The Evolution of top Incomes: A Historical and International Perspective.” NBER Working Paper 11955 (January).
4 We are currently collecting additional ancient inequality observations such that a larger sample will allow econometric analysis of determinants.


