Now that we have micro data, especially economy-wide industry databases, it is possible to look at China’s post-reform productivity performance in more detail. For example, using manufacturing firm data, Hsieh and Klenow (2009) have shown that resource misallocation in China could have caused between 23% and 33% loss in total factor productivity (TFP) growth. This has challenged the dominant view that more than 40% of China’s growth could have been attributed to productivity growth (Bosworth and Collins 2008, Perkins and Rawski 2008, Zhu 2012). It has also raised a question about the suitability of the aggregate production function approach used in most studies of this type. This approach implicitly assumes that all industries face the same factor costs as if they were in a perfect market, without any barrier to factor mobility.
Recently, one of the authors of this column applied Jorgenson’s growth accounting approach, incorporated with Domar aggregation, to a new dataset called the China Industrial Productivity (CIP) Database (Wu 2016). The research showed that TFP growth contributed only 13.5% of China’s GDP growth in 1980-2010. At the same time, misallocation of capital caused a loss in productivity growth of 11.4%.
The same research grouped industries based on their relationships with the government, or distances from the market, and used this to show that industry groups in which there were many government interventions were more likely to have slow TFP growth than those that were subject to market competition. This confirms that Chinese industries face different factor costs. Therefore, it would be inappropriate to weight them identically in an aggregate production function framework. Frankly, the claim that 40% of China’s post-reform growth could be attributable to TFP growth is an illusion, based on a mis-specified model applied to misused aggregate data.
The role of ICT
The CIP dataset offers the potential to explore the industry origin of China’s productivity performance. First priority is to investigate the role of ICT. China’s post-reform integration into the world economy, especially joining the WTO, has been accompanied by a burst of productivity in the industries producing ICT equipment. This has led to a continuous fall in the prices of ICT, increasing investments in ICT assets, and capital-deepening across industries.
Jorgenson (2001) shows that the growth of ICT capital services in the US jumped from 11.5% per annum between 1990 and 1995 to 19.4% between 1995 and 1999. In contrast, the growth of non-ICT capital services increased from 1.7% to 2.9% in the same period. Between 1990 and 1995, ICT-producing industries accounted for 29% of the 4.08% annual GDP growth in the US, but contributed 67% of the aggregate TFP. Other advanced economies show a similar role for ICT found in (Spiezia 2011).
Thanks to the continuous rapid improvement in ICT that Moore’s Law delivers, and because ICT is a general purpose technology (innovations in the ICT-producing industries cause unexpected economy-wide positive externalities), ICT could have substantially increased competition in sectors using mature technologies. This has dampened the effectiveness of government intervention and improved the efficiency of resource allocation in countries such as China. Indeed, our recent research shows that between 1990 and 2015, the annual compound growth rates of China’s production of personal computers, integrated circuits, and semiconductors were 40.7%, 31.8%, and 22.7% respectively, compared to the 14.7% gross output growth of the manufacturing sector as a whole (Wu and Liang 2017). Thus, China’s growth and productivity performance cannot be properly estimated without understanding the role of ICT.
Choosing the proper methodology
But we lack statistics on ICT investment at the industry level. This has prevented us from directly identifying the extent to which individual Chinese industries make and use ICT equipment. We adopt an indirect approach to bypass this problem. We categorize all 37 industries in the CIP dataset into ICT-specific groups using the classification criteria for ICT-producing, ICT-using manufacturing and services, and non-ICT sectors, as was done in the US research. Previous empirical studies have shown that this is justified, because the diffusion of ICT has significant similarities across countries (van Ark et al. 2002, O’Mahony and de Boer 2002). We also argue that the rapid globalisation through direct investment and trade in manufacturing, especially following China’s WTO entry, enhanced this diffusion.
With some revisions and updates, we use the same CIP data as in Wu (2016).1 Based on the ICT-specific grouping, we analyse the CIP data in a growth accounting model based on Jorgenson (2001) that specify the role of industries in an aggregate production possibility frontier (APPF) framework. Incorporating the Domar aggregation approach allows us to decompose China’s productivity growth into the contribution of ICT-specific groups, and the factor reallocation effect across the groups.
Sources of growth
On average, Chinese ICT and non-ICT industries were almost equal drivers of growth between 1981 and 2012. As shown in Table 1, the three ICT-related groups made up 47% of China’s GDP growth between 1981 and 2012 – that is, 4.46 percentage points out of the 9.38% annual growth. When focusing only on the period from the 1990s onwards, matching the period with the period which, in previous research, showed an increasing impact of ICT on TFP, the contribution of ICT-related groups to growth increased after China’s WTO entry from 40% (1991-2001) to 56% (2001-2007). Industries that use ICT equipment most intensively expanded more rapidly than others. Possibly they were benefited by the spillover effect of the rapid decline in the prices of ICT assets.
Table 1 Sources of aggregate value-added growth in China, 1981-2012
(Contributions are weighted-growth rate in percentage points)
Source: Wu and Liang (2017). Results are reorganised.
Examining the sources of the 9.38% annual GDP growth between 1981 and 2012, the contribution of capital input was 7.64 percentage points on average, dwarfing the role of labour input (0.88 percentage points) and TFP growth (0.86 percentage points). We estimate the TFP contribution to China’s growth to be only 9.2%, even smaller than the earlier CIP-based estimate of 13.5% in Wu (2016). This is because our updated CIP data include a longer period after the Global Crisis, with the poorest TFP performance (-1.42 percentage points).
Industry origin of aggregate TFP growth
On average, 73% (0.63 percentage points) of the 0.86% aggregate TFP growth from 1981 to 2012 could be attributed to the contribution of industries and 27% (0.23 percentage points) to the reallocation of factors across industries (Table 2). By decomposing the industry origin TFP into four ICT-specific groups, we find that China is no exception to the international trend. Both ICT-producing and ICT-using manufacturing groups played a remarkable role, especially the contribution (0.92 percentage points) of ICT users. This is about 2.5 times the contribution of ICT producers (0.37 percentage points).
Table 2 also shows losses in TFP growth for both the ICT-using services (0.14 percentage points) and non-ICT (0.52 percentage points) groups. The poor TFP performance of the ICT-using group makes China an outlier. Most of the industries in this group (trade, transportation, finance, scientific research, and so on) are state-owned. We can then substantiate the claim in Wu (2106) that industries prone to government interventions were less productive than those close to the market, by showing that state-monopolised industries are inefficient, even if they are highly exposed to ICTs.
Table 2 Decomposition of China’s aggregate TFP growth, 1981-2012
(Contributions shown in Items 1-3 are weighted-growth rate in percentage points)
Source: Wu and Liang (2017). Results are reorganised.
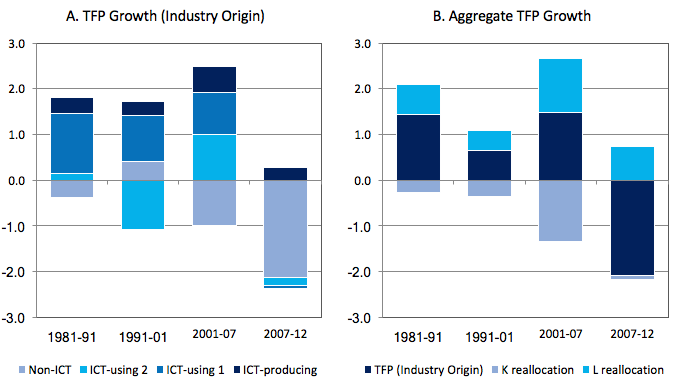
We split the industry-origin TFP performance, by industry group, over sub-periods (Table 2). In Figure 1, we can show the composition of our estimated TFP growth in two connected panels. Panel A shows how ICT-specific groups contribute to the industry-origin TFP growth, and Panel B shows how the items in Panel A, together with factor reallocation effects, make up the aggregate TFP growth.
Panel A shows, as we might expect, the period following China’s WTO accession in 2001 was a contrast with the 1990s. Between 2001 and 2007 the ICT-using services joined the other two ICT-related groups and made a significant contribution to industry-origin TFP growth. But the non-ICT group did not sustain its TFP growth from the 1990s, and suffered a big loss in productivity. The Global Crisis was a shock to TFP growth (-2.08% per annum), yet attributable mainly to the non-ICT industries (-2.13 percentage points, as in Table 2). In contrast, the ICT-related groups showed strong resilience to the crisis. The ICT-producing group remained TFP-positive, whereas the other two ICT groups made a small loss in TFP growth.
Figure 1 Decomposition of China’s aggregate TFP growth, 1981-2012
(Contributions are weighted-growth rate in percentage points)
Source: Table 2.
Notes: The sum of the four items in Panel A equals to the total TFP (industry origin) growth through the Domar aggregation, which is exactly the same as 'TFP (industry origin)' in Panel B (both could be measured by their altitudes). The sum of the three items in Panel B equals to the aggregate TFP growth. 'ICT-using 1' is ICT-using manufacturing, as in Table 2, and 'ICT-using 2' is ICT-using services, as in Table 2.
Factor reallocation and policy implications
Panel B of Figure 1 shows that, in addition to the industry-origin TFP growth, there have also been considerable capital and labour reallocation effects on China’s aggregate TFP growth. This has not typically been observed in market economies. Jorgenson et al. (1987) show that, when not negligible, the reallocation of capital tends to be positive and the reallocation of labour tends to be negative. This is because capital grew more rapidly in industries with high capital-service prices, whereas labour grew relatively slowly in industries with high marginal compensation.
We find the opposite. China’s labour reallocation effect was positive over time. This may suggest that there was continuous improvement of the labour market during the reform period, increasing labour mobility. Nonetheless, China’s capital reallocation effect remained negative, implying that there was a severe misallocation of capital resources.
In a nutshell, while sharing 29% of China’s 9.38% annual value-added growth (as in official accounts), Chinese ICT-producing and ICT-using manufacturing industries contributed 149% of China’s 0.86% annual aggregate TFP growth between 1981 and 2012. This enabled the economy to compensate for heavy productivity losses caused by persistent misallocation of capital resources, and the inefficiency of sectors in which the government intervened.
Editors’ note: The main research on which this column is based first appeared as a Discussion Paper of the Research Institute of Economy, Trade and Industry (RIETI) of Japan.
References
Bosworth, B and S M Collins (2008), “Accounting for Growth: Comparing China and India”, Journal of Economic Perspectives 22(1): 45–66.
Hsieh, C and P J Klenow (2009), “Misallocations and Manufacturing TFP in China and India,” Quarterly Journal of Economics, CXXIV(4): 1403-1448.
Jorgenson, D W (2001), “Information Technology and the U.S. Economy”, The American Economic Review 91(1): 1-32.
Jorgenson, D W, F Gollop and B Fraumeni (1987), Productivity and U.S. Economic Growth, Harvard University Press.
O'Mahony, M, and W de Boer (2002), “Britain's Relative Productivity Performance: Has Anything Changed?” National Institute Economic Review 179: 38-43.
Perkins, D H and T G Rawski (2008), “Forecasting China's Economic Growth to 2025”, in L Brandt, T G Rawski (eds) China's Great Economic Transformation, Cambridge University Press.
Spiezia V (2011), “Are ICT Users More Innovative? An Analysis of ICT-Enabled Innovation in OECD Firms”, OECD Journal: Economics Studies 2011(1): 1-21.
van Ark, B, J Melka, N Mulder, M Timmer and G Ypma (2002), “ICT Investment and Growth Accounts for the European Union, 1980-2000”, Final Report on ICT and Growth Accounting for the DG Economics and Finance of the European Commission.
Wu, H X (2015), “Constructing China’s Net Capital Stock and Measuring Capital Service in China”, RIETI Discussion Paper 15-E-006.
Wu, H X (2016), “On China’s strategic move for a new stage of development – a productivity perspective”, in D W Jorgenson, K Fukao, and M P Timmer (eds) The World Economy: Growth or Stagnation? Cambridge University Press.
Wu, H X and K Ito (2015), “Reconstruction of China’s National Output and Income Accounts and Supply-Use and Input-Output Accounts in Time Series”, RIETI Discussion Paper 15-E-004.
Wu, H X and D T Liang (2017), “Accounting for the Role of Information and Communication Technology in China’s Productivity Growth”, RIETI Discussion Paper 17-E-111.
Wu, H X, X Yue and G G Zhang (2015), “Constructing Employment and Compensation Matrices and Measuring Labor Input in China”, RIETI Discussion Paper 15-E-005.
Zhu, X (2012), “Understanding China's Growth: Past, Present, and Future”, Journal of Economic Perspectives 26(4): 103-24.
Endnotes
[1] For details of thess data, see Wu (2015), Wu and Ito (2015), and Wu et al. (2015).


