Empirical studies on the economic impact of corruption show mixed results. Some support the view that corruption has the potential to foster development, because it provides much-needed grease to lubricate the wheels of rigid government administration and regulation (Leff 1964, Méon and Weill 2010). The alternative view, promoted by 'sand the wheels' advocates, is that corruption reduces economic performance due to rent-seeking, increase of transaction costs and uncertainty, inefficient investment, and misallocation of production factors (Mauro 1995, Tanzi and Davoodi 1997, among others).
Research tends to focus on the effect of firm-level bribery on within-firm productivity (De Rosa et al. 2010, Hanousek and Kochanova 2015) or on the impact of total economy corruption on a country’s aggregate economic performance. Our recent work uses survey-based firm-level data on corruption instead (Gamberoni et al. 2016). We investigate its relationship with a measure of intra-sector misallocation of production factors. This is, in turn, a significant component of sector TFP growth.
We focus on six non-financial private sectors in nine Central and Eastern European (CEE) countries: Croatia, the Czech Republic, Estonia, Hungary, Lithuania, Poland, Romania, Slovakia and Slovenia. These countries are interesting if you want to analyse the link between corruption and input misallocation because:
- Following their entry into the EU, significant action was taken to fight corruption, although the extent of this work varied;
- Corruption is still high in CEE countries relative, for example, to core Eurozone countries, suggesting large scope for improvement;
- Input misallocation in the CEE region as a whole has not been previously studied. An extension of the analysis also to Western EU countries would be warranted given the documented presence of corruption at the total economy level, but similar firm-level data in repeated years are currently unavailable for these countries.
A frequently employed measure of input misallocation, based on the pioneering work of Hsieh and Klenow (2009) and used for example by Gopinath et al. (2015) and Garcia-Santana et al. (2016), is the dispersion in the marginal revenue productivity of labour (MRPL) or capital (MRPK) across firms. We assume that the marginal costs of inputs faced by enterprises are the same in each sector of the economy (when this assumption is relaxed, it does not significantly affect the results in Gamberoni et al. 2016). So, in a static environment, the returns to capital and labour should be equalised across firms operating within the same sector. Firm-specific or business environment distortions including corruption may, however, avert the productivity-enhancing flow of resources and induce differences in the MRP of inputs across enterprises. This implies resource misallocation.
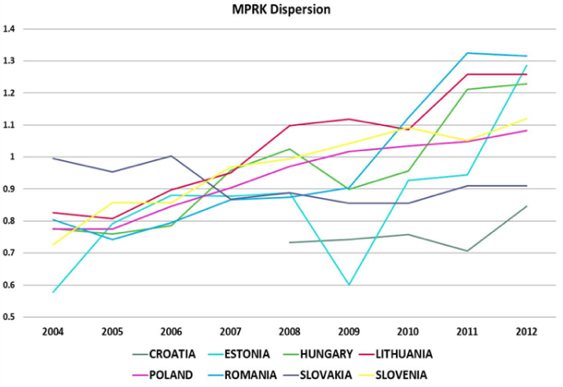
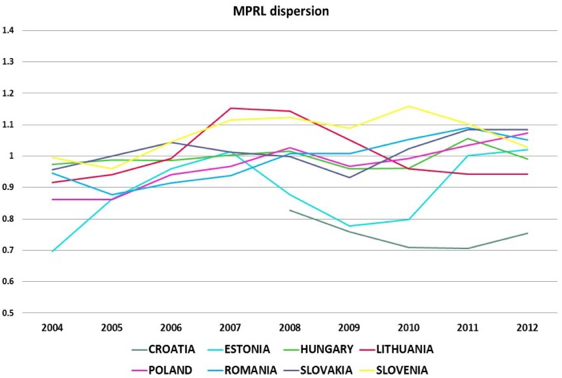
Figure 1, based on the ESCB CompNet micro-aggregated data described in Lopez-Garcia et al. (2015), shows that since 2003 capital misallocation has been increasing sharply in most CEE countries. Conversely, labour misallocation rose mildly until the global financial crisis and declined thereafter, although generally only temporarily. Services were the main drivers of these aggregate developments.
Figure 1 Capital and labour misallocation in the CEE region
(weighted averages of the dispersion in the marginal productivity of inputs across sectors)
Notes: Weighted average values, where the weights are the time-varying country-specific sectorial shares of value added. Data for Poland are available starting in 2005, while data for Lithuania and Slovakia end in 2011. Data for Poland and Slovakia are based on samples of firms with more than 20 employees.
Source: Own calculations based on CompNet data.
In order to measure corruption, we used firm-level data from the Business Environment and Enterprise Performance Survey (BEEPS), taken in selected years by the World Bank and by the European Bank for Reconstruction and Development. BEEPS provides information on both the frequency and amount of bribes that, according to the interviewed firms, similar enterprises in their line of business need to pay to 'get things done'. It also offers data on the frequency of bribes paid to conduct specific administrative practices, in particular to deal with courts, pay taxes, and handle customs.
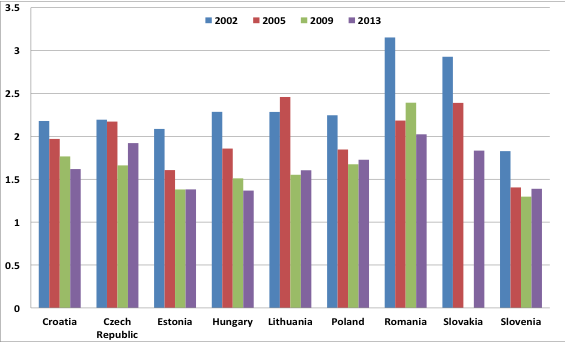
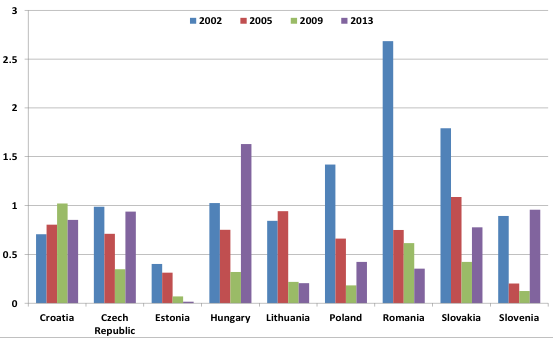
Starting from relatively high levels in 2002, BEEPS data show corruption decreasing in CEE countries during the past decade, although the intensity of the decline has been different across countries (Figure 2). This evidence is consistent with total-economy measures in Transparency International or the World Bank Governance Indicators. In addition to cross-country differences, there is large heterogeneity in the frequency of bribe payments across sectors, and across firm size classes. Indeed, firms operating in different industries interact with public officials to a different extent. They require a different number of licenses and permits due to the specific characteristics of their production processes.
According to BEEPS data, the construction sector presents the highest frequency and amount of bribes. Moreover, we find that firms with fewer than ten employees report that, in their line of business, bribes are paid less frequently to get things done, possibly because these firms are often exempt from restrictive regulations. A similar result is found for very large firms, which have the bargaining power and influence to resist pressures from bribe-seeking officials.
Figure 2 Frequency and amount of bribes paid to get things done in CEE countries, 2002-2013
Frequency (1=never; 6= always)
Amount (in percentage of sales)
Note: Averages across all firms in a given country and year.
Source: Own calculations based on BEEPS data.
The link between corruption and input misallocation
By combining the corruption measures with the input misallocation indicators, we created a unique dataset that we employ to explore the link between the two phenomena. Following the most recent cross-country convergence literature, which has emphasised the role of interactions amongst covariates in explaining economic development (e.g. Tan 2010), we also consider framework conditions, such as the size of a country, the industrial organisation of corruption (that is, the degree of power and the time horizon of the bureaucrats in service), and the quality of regulation. We do this to measure the significance and sign of the relationship between corruption and allocative inefficiency.
In line with similar findings in Rock and Bonnett (2004), we find evidence that, in particular in smaller countries and in countries with lower political stability, changes in corruption are positively correlated with both capital and labour misallocation dynamics. As suggested by Olson (1993), the intuition underlying this result is that 'stationary bandits' in office will monopolise theft (corruption) in their country while limiting what they steal, since they know that their future profits will depend on the incentives of their subjects to invest and expand. Conversely 'roving bandits' have short time horizons and no incentive to limit corruption, since seizing assets will be a dominant strategy if their position is unstable. In countries with higher-than-average political stability, we find evidence of a slightly higher relative frequency of bribes, but a significantly lower relative amount of bribes paid.
We also find that, in countries with low-quality regulation, changes in corruption positively affect input misallocation growth. This offers no evidence in favour of the ‘grease the wheels’ hypothesis.
We also consider some instrumental variables for corruption, including the share of women in parliament, to avoid possible omitted variable bias. Greater political participation of women has been associated with lower levels of corruption (Dollar et al. 1999, Brollo and Troiano 2016). This may be because of a greater risk aversion or fear of punishment in the case of detection, or it may be because bribe-seeking and bribe-paying takes place in a male network that excludes women. This instrumental variable confirms our baseline findings.
The link between corruption and input misallocation is conditional on the geographical, institutional and political setting. Targeted action against corruption should therefore be embedded in a more comprehensive strategy of institutional reform. Anti-corruption measures appear more efficiency-enhancing when implemented in small or politically unstable countries. Improving the quality and the effectiveness of the regulatory environment is a means to support TFP growth directly, but also indirectly by reducing the boost corruption exerts on input misallocation.
Authors’ note: The views expressed herein are those of the authors and not necessarily those of the European Central Bank and of Banca d’Italia.
References
Brollo, F. and Troiano, U. (2016), “What Happens When a Woman Wins an Election? Evidence from Close Races in Brazil", Journal of the Development Economics, forthcoming.
Churchill, R.Q., Agbodohu, W. and Arhenful, P. (2013), “Determining Factors Affecting Corruption: A Cross Country Analysis”, International Journal of Economics, Business and Finance 1(10), pp. 275-285.
De Rosa, D., Gooroochurn, N. and Görg, H. (2010), “Is it worth it: Does corruption influence firm productivity?”, VoxEU.org, 30 August.
Dollar, D., Fisman, R. and Gatti, R. (1999), “Are Women Really the “Fairer” Sex? Corruption and Women in Government”, Policy Research Report on Gender and Development Working Paper 4.
Gamberoni, E., Gartner, C., Giordano, C. and Lopez-Garcia, P. (2016), “Is corruption efficiency-enhancing? A case study of nine Central and Eastern European countries”, ECB Working Paper 1950.
Garcia-Santana, M., Moral-Benito, E., Pijoan-Mas, J. and Ramos, R. (2016), “Growing like Spain: 1995-2007”, VoxEU.org, 23 May.
Gopinath, G., Kalemli-Ozcan, S., Karabarbounis, L. and Villegas-Sanchez, C. (2015), “Low interest rates, capital flows, and declining productivity in South Europe”, VoxEU.org, 28 September.
Hanousek, J. and Kochanova, A. (2015), “Bribery environment and firm performance: Evidence from central and eastern European countries”, VoxEU.org 4 May.
Hsieh, C.-T. and Klenow, P. (2009) “Misallocation and manufacturing TFP in China and India”, Quarterly Journal of Economics, 124(4), pp. 1403-1448.
Lopez-Garcia, P., di Mauro, F. and the CompNet Task Force, (2014), “Assessing European Competitiveness: the new CompNet micro-based database”, ECB Working Paper 1764.
Lui, F.T. (1985), “An equilibrium queuing model of bribery”, Journal of Political Economy 93(4), pp. 760-781.
Mauro, P. (1995), “Corruption and Growth”, The Quarterly Journal of Economics, 110(3), pp. 681-712.
Meon, P-G. and Weill, L. (2010), “Is Corruption an Efficient Grease?”, World Development 38(3).
Rock, M.T. and Bonnett, H. (2004), “The Comparative Politics of Corruption: Accounting for the East Asian Paradox in Empirical Studies of Corruption, Growth and Investment”, World Development 32(6), pp. 999-1017.
Tan, C.M. (2010), “No one true path: Uncovering the interplay between geography, institutions and fractionalization in economic development”, Journal of Applied Econometrics 25, pp. 1100-1127.
Tanzi, V. and Davoodi, H. (1997), “Corruption, Public Investment and Growth”, IMF Working Paper 139.


