The inability of credit rating agencies to anticipate sovereign-debt crises and the tendency to overreact once financial difficulties have piled up are well-known phenomena. Ferri et al. (1999) show that the downgrades by Moody’s and S&P exacerbated the Asian crisis in 1997. Examining the Great Depression, Gaillard (2011) and Flandreau et al. (2011) find that major credit rating agencies did not lower sovereign credit ratings until 1931.
The ratings assigned by Fitch, Moody’s, and S&P to Eurozone members since 1999 illustrate these chronic shortcomings. For example, no Eurozone country was downgraded by Moody’s during the 1999-2008 period and none was upgraded by this agency between 2009 and mid-2013! More worrying still is that Greece, which was forced to restructure its debt in February 2012, has been the highest-rated defaulting country since sovereign rating rebounded in the mid-1980s. The Hellenic Republic was rated in the single-A category until June 2010 and in the investment-grade category until January 2011 by at least one credit rating agency.
Recent research: The Greek debt restructuring
In a forthcoming paper (Gaillard 2014), I will demonstrate that these late downgrades lowered the accuracy of the three credit rating agencies’ ratings and revealed how ‘sticky’ sovereign ratings can be.
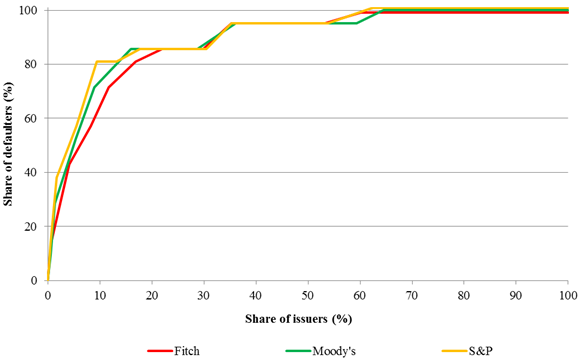
The accuracy of sovereign ratings may be measured by examining ratings prior to default, by computing cumulative default rates, or by computing accuracy ratios. The last of these, which is the most commonly used approach, consists of tracing cumulative accuracy profile curves and computing accuracy ratios. Both cumulative accuracy profiles and accuracy ratios are designed to establish whether cumulative accuracy profiles manage to assign low ratings to issuers that default and high ratings to issuers that do not. Thus a cumulative accuracy profile curve facilitates a visual and qualitative assessment of such ratings performance. The curve is constructed by sorting the sovereign issuers from lowest to highest rating and then plotting, for each rating category, the percentage of defaults accounted for by sovereigns with the same or a lower rating against the percentage of all sovereigns with the same or a lower rating. The more the cumulative accuracy profile curve ‘bows’ toward the upper left corner, the greater the fraction of all defaults that are accounted for by the lowest rating categories (for a more detailed explanation, see Moody’s Investors Service 2000).
Figures 1 and 2 display the three-year and five-year cumulative accuracy profile curves, respectively for all countries rated simultaneously by Fitch, Moody’s, and S&P from 1 January 2001 until 1 January 2013. For these two time horizons, examining cumulative accuracy profile curves does not reveal which agency’s ratings best predict default because the curves cross one another. Therefore, comparing the performance of the three cumulative accuracy profiles requires the computation of accuracy ratios.
Figure 1. Three-year cumulative accuracy profile curves, 1 January 2001–1 January 2013
Source: Gaillard (2014).
Figure 2. Five-year cumulative accuracy profile curves, 1 January 2001 – 1 January 2013
Source: Gaillard (2014).
The accuracy ratio distils the information reflected in a cumulative accuracy profile curve into a single summary statistic: the ratio of the area between the cumulative accuracy profile curve and the 45 degree line to the total area above the 45 degree line. Accuracy ratios range between -1 and 1, where 1 represents maximum accuracy (i.e., all defaulters are assigned the lowest rating) and -1 represents worst performance (i.e., all defaulters are assigned the highest rating).
Table 1 presents the three-year and five-year accuracy ratios for the three agencies for two periods: 1 January 2001–1 January 2011 and 1 January 2001–1 January 2013 (hence the latter span includes Greece’s default). It is noteworthy that S&P’s accuracy ratios are the highest for the two periods and the two time horizons. However, the Greek debt restructuring reduced the accuracy ratios of the three agencies, particularly those of Moody’s. For the three-year horizon, Moody’s has the lowest accuracy ratio because it assigned the highest rating to Greece at the beginning of the third year preceding its default: on 1 January 2010, Greece was rated A2 by Moody’s versus BBB+ by both Fitch and S&P. In fact, the three-year accuracy ratio of Moody’s is severely depressed by its late downgrading of Greece. For the five-year horizon, the performance of Moody’s is better than that of Fitch even though the former assigned a higher rating (A1 versus A) to Greece five years prior to its default. This unexpected finding reflects that 86% of default observations are scattered across the entire BB, B, and CCC rating categories for Fitch but are confined to the B rating category (and below) for Moody’s.
Table 1. Accuracy ratios
Notes: Sample 1 consists of 747 annual observations for 84 sovereign issuers rated simultaneously by Fitch, Moody’s, and S&P from 1 January 2001 to 1 January 2011. Seven sovereign defaults are observed: Argentina (2001), Indonesia (2002), Uruguay (2003), the Dominican Republic (2005), Venezuela (2005), Ecuador (2008), and Jamaica (2010). Sample 2 consists of 913 annual observations for 84 sovereign issuers rated simultaneously by the three CRAs from 1 January 2001 to 1 January 2013. Eight sovereign defaults are observed: the seven listed previously plus Greece (2012). Sources: Gaillard (2011, 2014).
Sticky and lenient ratings
The examination of accuracy ratios indicates that Fitch, Moody’s, and S&P were late to adjust the ratings they assigned to Greece. This contrasts with the evolution of market-based indicators, such as credit default swaps.
Comparing Fitch, Moody’s, and S&P sovereign ratings with ten-year credit default swap-implied ratings in 2009-2010, I found (2011) that the risk of default reflected in the agencies’ ratings in mid-May 2010 (following the establishment of the European Stabilisation Mechanism) was still lower than the risk reflected in the credit default swap-implied ratings at the beginning of the Greek crisis (as of 1 January 2010). More impressively, for the main three peripheral countries (Italy, Spain, and Portugal), no less than 19 months on average transpired before credit ratings were equivalent to the credit default swap-implied ratings at mid-May 2010.
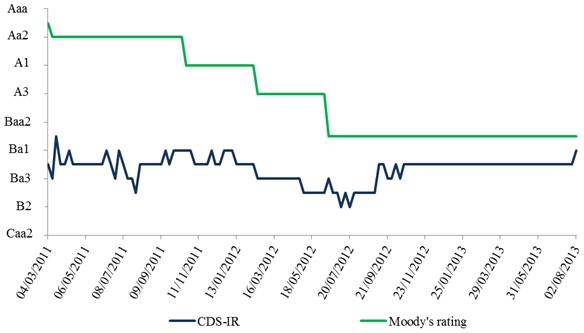
The recent evolution of credit ratings shows that they have been much more lenient than credit default swaps. Figure 3 plots Moody’s rating and its computed five-year credit default swap-implied ratings for Spain for the period from 4 March 2011 to 2 August 2013. Moody’s rating was substantially higher than the credit default swap-implied ratings. The maximum gap (11 notches) was reached in July 2011 when it became evident that Greece would have to restructure its public debt, thus threatening the creditworthiness of other peripheral countries. Since August 2012, investors have ‘upgraded’ the credit default swap-implied ratings of Spain. Similar trends can be observed for most Eurozone countries.
One may assume that, though it did not solve the Eurozone debt crisis (Pâris and Wyplosz 2013), the announcement by European Central Bank President Mario Draghi of the Outright Monetary Transactions program had the effect of reducing risk aversion.
Figure 3. Moody’s ratings versus five-year credit default swap-implied ratings: Spain
Source: Calculations based on Moody’s data.
Conclusion
Since 2009, credit ratings have persistently lagged behind credit default swaps. Although hardly surprising – given that markets can instantaneously incorporate new economic and financial information – these findings are valuable for policymakers. In particular, they support the view that the credit ratings assigned to Eurozone countries have been more flattering than expected and that credit default swaps may simply be too volatile to be used for regulatory purposes.
References
Ferri, G, Liu, L-G and Stiglitz, J (1999), “The Procyclical Role of Rating Agencies: Evidence from the East Asian Crisis”, Economic Notes, Banca Monte dei Paschi di Siena SpA, No.3.
Flandreau, M, Gaillard, N, and Packer, F (2011), “To Err is Human: Rating Agencies and the Interwar Foreign Government Debt Crisis”, European Review of Economic History 15(3).
Gaillard, N (2011), A Century of Sovereign Ratings, Springer, New York.
Gaillard, N (2014), “What Is the Value of Sovereign Ratings?”, German Economic Review 15(1).
Moody’s Investors Service (2000), “Benchmarking Quantitative Default Risk Models: A Validation Methodology”, March.
Pâris, P and Wyplosz, C (2013), “To End the Eurozone Crisis, Bury the Debt Forever”, VoxEU.org, 6 August.


