The OECD has documented that in recent decades, many countries have increased the tax support they provide for research and development (R&D) (OECD 2013, 2014). The traditional model of funding has been to have government bureaucrats sifting through project proposals and then deciding which are the most deserving. An alternative is to let firms decide where to put their research money and simply treat R&D more generously through the tax code. This saves administrative costs, but may be inefficient if the government is good at spotting which projects will generate big knowledge ‘spillovers’. But governments may not be great at this and may be tempted to spend more on vanity projects for the politically connected.
In April 2000, the UK joined the growing list of countries offering a more generous tax deal for R&D. It did so because the UK has a productivity problem. GDP per hour is 30% below that in France, Germany and the US. Since productivity growth is the main determinant of income growth, this is a major problem for the UK economy.
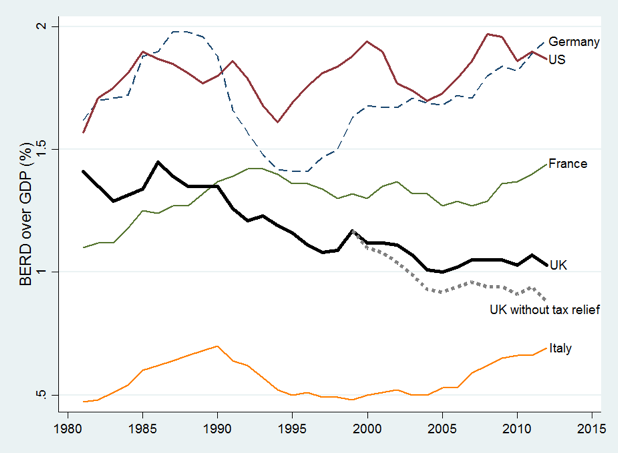
The UK also has an innovation gap mirroring the productivity gap. Business R&D is also below that of its peers (see Figure 1). Furthermore, whereas most countries have been increasing the share of GDP devoted to R&D, UK R&D began a sharp downhill slide from the early 1980s. The downward path is due to many things including a rapid decline of R&D intensive manufacturing. But interestingly, the downward trend levelled off in the 2000s, at the same time as the tax credit system became more generous.
Figure 1 Business enterprise research and development as a fraction of GDP
Note: The data are from OECD MSTI downloaded February 9th 2016. The dotted line is the counterfactual R&D intensity in the UK that we estimate in the absence of the R&D Tax Relief Scheme.
The policy experiment
Could the improvement in R&D and the tax changes just be a coincidence?
It’s hard to know from the macro data, but there was a neat policy experiment in 2008 that helps to tease this out.
The UK, like most other countries, offers more generous subsidies to small and medium-sized enterprises (SMEs) than larger firms. But what is an SME? When the tax credit was introduced, the UK just used the standard EU-wide definition. But in 2008, the government decided to raise the thresholds for what counted as an SME only for the R&D tax credit system.
Firms with assets below above €43m but below €86m weren’t counted as SMEs before 2008; then after 2008 they were counted as SMEs! This reduced the cost of their R&D by over 30% – and our research finds that this led to big increases in their R&D and, more importantly, their level of innovation as measured by patenting (Dechezlepretre et al. 2016).
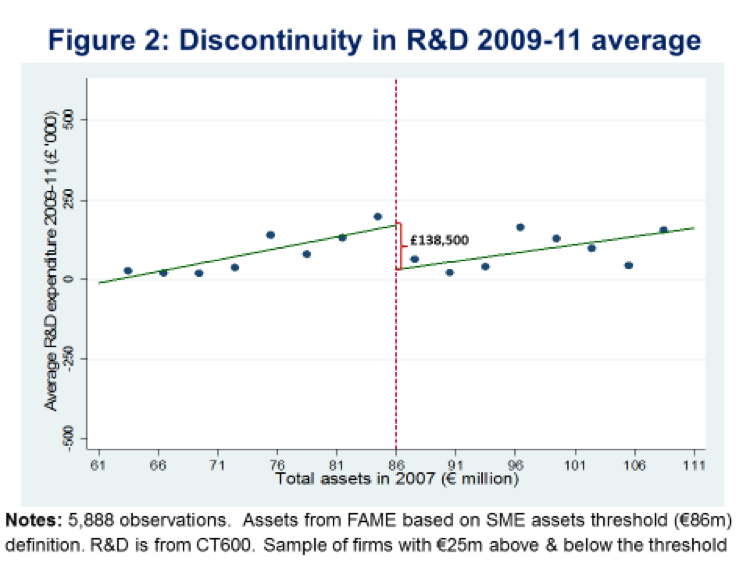
The best way to see this is to look at what happens around the new tax threshold using a ‘regression discontinuity design’. We were granted confidential access to the universe of firms’ tax records and accounts through the HMRC Datalab (over two million companies).
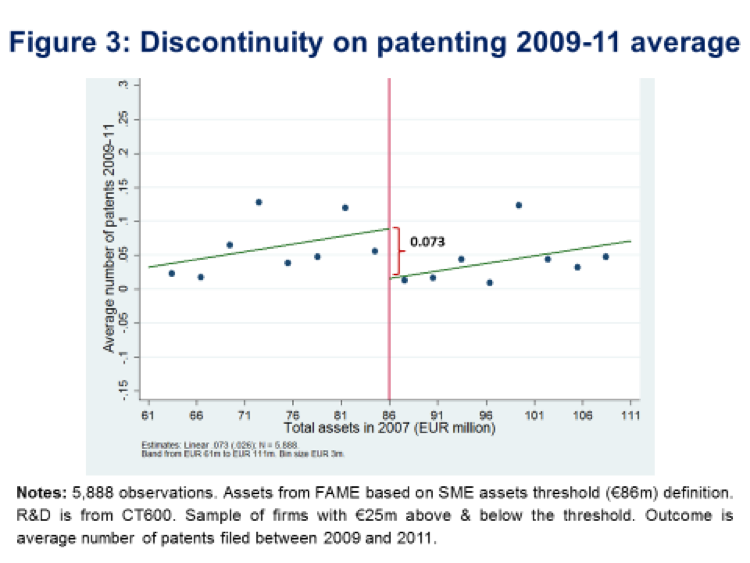
When looking at firms’ 2009 levels of R&D as a function of their pre-policy pre-2007 level of assets, Figure 2 shows that a firm just below the new SME threshold had an unexpectedly large jump in their R&D. Figure 3 shows that exactly the same thing happened for patents. Since there are no other policies that kick in that threshold, it seems likely that the big jumps in R&D and patents were due to the new policy. The magnitudes are large: there was roughly a doubling of R&D and a 60% increase in innovation as a result of the policy.
Seeing an impact on innovation is particularly important, as a worry about R&D tax credits is that firms don’t do more R&D, but instead re-label activities that weren’t previously classified as R&D (such as marketing expenses and managers) to take advantage of the largesse of the tax collection agency. But there is no incentive to do this for patents.
We also show that the quality of patents did not deteriorate. Firms increased the rates at which they applied for (high value) EU-wide patents as well as (lower value) UK only patents, for example. The citation rate per patent, another indicator of value, also did not decline for firms that benefited from the policy.
Similarly, we find that firms that received a bigger incentive to do R&D increased in size, whether measured by sales revenues or by the number of jobs
Why such a big effect?
We calculate what the effective reduction in the ‘price’ of R&D from the changing policy was and compare this with the R&D response. This generates a tax-price elasticity of about 2.6, in other words, a 10% fall in the price generates about a 26% increase in the volume of R&D. This is a bigger response than other studies find (Becker 2015, Hall and Van Reenen 2000).
The reason for the greater policy effectiveness is simple. Most other studies have implicitly or explicitly focused on large firms, whereas the policy we look at targets SMEs. The gap in the literature is because rich data on SMEs have only recently become available – SMEs are typically under no obligation to report their R&D spending publicly, so it is only when we are able to use administrative micro-data that such studies can be done. And although industry-level and macro data implicitly includes smaller firms via confidential government surveys, the aggregate numbers are dominated by larger firms (e.g. Bloom et al. 2002).
Smaller firms are more likely to face cash constraints in raising finance for innovation, and hence underspend. In fact, this is the very reason why governments typically give them more generous subsidies to perform R&D than larger firms.
In our data, we find that it was younger firms that were most responsive, which makes sense in terms of their greater liquidity constraints. The market knows least about young firms and therefore will be unlikely to lend adequate amounts as innovation has little collateral and is subject, by its nature, to an acute lack of information.
Policy bottom lines
We evaluate the aggregate effects of the UK’s R&D tax policy since 2000 using our tax-price elasticity estimates for SMEs, other estimates in the literature for large firms, and the evolution of the tax system through 2013.
We find that the policy regime had a substantial impact on R&D. Figure 1 compares what actually happened to business R&D with what we would have expected to happen in the absence of R&D tax breaks. It is clear that the long-term decline of UK R&D intensity would have continued unabated. Furthermore, we calculate that business R&D would be 10% lower if the tax breaks were abolished.
Over the 2006-2011 period of our study, taxpayers gave up about £1 billion per year to induce firms to generate an additional £1.7 billion of R&D. A 1.7 to 1 ratio is a pretty good return for any policy, let alone for R&D.
Of course, this is not the end of the story. What matters is what the R&D does. We find that the R&D increased innovation and growth for the firms that received the tax relief. But we also find that there are technology spillovers even for firms that did not receive tax incentives. Firms that were operating in similar technology areas to the firms that were ‘exogenously shocked’ into doing more R&D as a result of the policy also increased their innovation rates.
These technology spillovers magnify the impact of the policy. Indeed, they are the reason why too little money is likely to be spent on R&D in the first place, as firms only receive a fraction of the returns for their R&D efforts.
The bottom line is that the return to £1 of taxpayer’s money in GDP terms is much higher than £1.70. The policy easily passes a cost-benefit test.
Parties of all political stripes have, so far, supported and extended the R&D tax relief system. It is an unusual example in the UK of political consensus around a growth policy. But as austerity continues, there is ever-mounting pressure to cut back on a system that today costs around £1.4 billion a year. Our study suggests that this is an innovation policy that works and which, in the long run, fosters productivity growth. At a time when underlying growth is so desperately needed, the policy should be preserved, not undermined.
References
Becker, B. (2015) “Public R&D policies and private R&D investment: A survey of the empirical evidence”, Journal of Economic Surveys 29(5) 917–942
Bloom, N., Griffith, R. and Van Reenen, J. (2002) “Do R&D tax credits work? Evidence from a panel of countries 1979–1997”, Journal of Public Economics 85(1) 1-31.
Dechezlepretre, A., E. Einio, R. Martin, K.-T. Nguyen and J. Van Reenen (2016), “Do Fiscal Incentives increase innovation? An RDD for R&D”, CEP Discussion Paper 1413
Hall, Bronwyn and John Van Reenen (2000) “Fiscal Incentives for R&D: A New Review of the Evidence”, Research Policy 29, 449-469,
OECD (2013) Survey of R&D tax credits, Paris.
OECD (2014) “Trends in R&D tax generosity and potential loss of predictability in tax regimes, 2001-11”, OECD Science, Technology and Industry Outlook 2014, Paris.


