On 15 November 2008, world leaders gathered in Washington DC for the first of a series of G20 summits on the global financial crisis and its economic fallout. At that meeting, G20 leaders pledged to eschew protectionism for twelve months. Subsequently, international trade experienced its sharpest ever contraction since WWII, raising concerns in the minds of some that failure to meet this pledge had reinforced the harm done to international trade by falling demand and limited trade finance.
Evaluating such concerns requires information on state-led changes in the discrimination against foreign commercial interests. The purpose of this chapter is to report the latest available information on such discrimination from one widely-used source of data on state measures undertaken since 1 November 2008, the Global Trade Alert. 1 I also discuss the implications of this evidence for the proper analysis of trade's recent collapse.
Crisis-era protectionism one year after the November 2008 summit
To coincide with the first anniversary of the Washington DC summit, a substantial update of the Global Trade Alert (GTA) database was conducted. It now contains reports on 606 state measures2 whose implementation was thought – prior to investigation – to possibly affect foreign commercial interests.3
State measures – for example, a national budget – can include changes in a number of policy instruments that might affect foreign commerce. Some of those measures have been implemented, some are only announced. To the extent that information on the latter provides a guide to the state measures likely to affect the world trading system over the next 6 to 12 months, then the GTA database provides some sense of the likely future course of crisis-era protectionism, as well as its recent trajectory.
Of the 606 state measures investigated, 402 have already been implemented.4 Far from every measure hurts foreign commercial interests. In fact, the GTA database includes 51 state measures that benefit importers and the like. Much of that liberalisation involves freeing up foreign direct investment regimes and lowering tariffs on non-finished goods.5 However, nearly three-quarters of implemented measures (294 to be precise) have almost certainly discriminated against foreign commercial interests. The harm done by these measures is not confined to a limited number of sectors, product categories, or countries. Another 56 state measures were likely to involve some discrimination against foreign commercial interests.
These facts can be illustrated in various ways:
- Since taking their pledge to eschew protectionism, G20 governments have together implemented 179 measures that harm foreign trade, investments, workers, and intellectual property
- On average, every other day a G20 government has broken the pledge made in Washington DC last November.
Further interpretation of this and other findings is presented in the next section.
The GTA database also contains 204 state measures that have yet to be implemented. Investigation has revealed that only 18 of these measures are likely to liberalise international commerce. In terms of the number of measures involved, implementation of what might be referred to as this protectionist overhang would expand the number of discriminatory measures by 50%. This finding is important as it implies that over the next 12 months economic recovery may be associated with an intensification of discrimination against foreign commerce.
The form of discrimination employed by governments is likely to change substantially from what is likely to be regarded as unusual from the first 12 months.
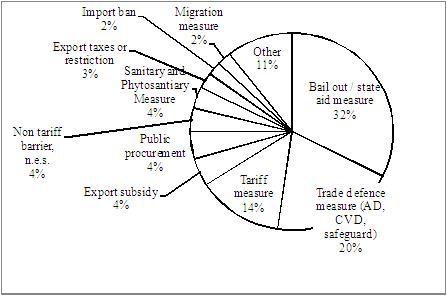
Figure 1 Financial assistance is the most prevalent form of discrimination implemented to date
Source: GTA database.
Figure 1 contains a pie chart of the 10 most popular forms of discriminatory measures implemented since 1 November 2008.
- Financial assistance packages (state aids, bailouts) are the most popular discriminatory instrument, accounting for a third of all harmful measures employed.
- This is followed by anti-dumping, countervailing duty, and safeguard actions, which collectively account for 20% of harmful measures implemented.
- Tariff increases account for one-seventh of the total, and every other form of discriminatory state measure for less than 5% of total measures.
Given the media attention to bank bailouts and the like, the share of financial assistance packages may not seem that surprising.
- Of the 101 such packages found to be discriminatory in the GTA database, just under 60% (59) targeted sectors other than banking, finance, and insurance.
Of the state measures likely to be implemented over the next 12 months, the so-called trade defence measures account for more than the majority and the share of bailouts is much smaller. The conventional pattern of protectionism in business cycle downturns may well reassert itself during 2010, implicitly highlighting just how unusual 2009 has been in this regard.
Nations implementing discriminatory state measures
In a perfect world, accompanying each GTA investigation would be an analysis of the impact on international commerce and welfare of every discriminatory state measure.6 Less computationally expensive indicators of the harm to foreign commercial interests done by a government are, however, available. These include:
- The number of harmful measures undertaken,
- The percentage of tariff lines and sectors affected by such measures, and
- The number of trading partners hurt by these measures.
For each trading jurisdiction, the GTA calculates all four indicators.
The naming-and-shaming figures
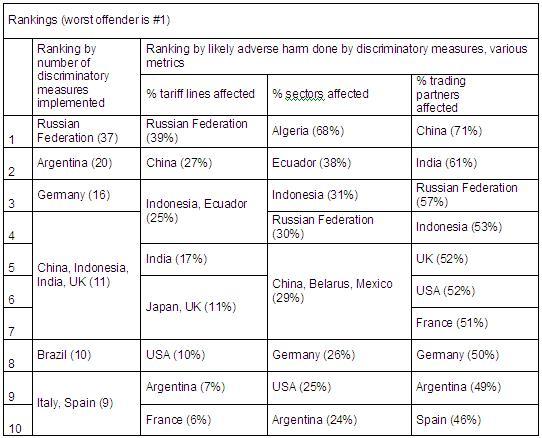
Data on the top 10 most discriminatory countries on each metric are reported in Table 1. This is the table for those interested in "naming and shaming."
The key points are:
- Irrespective of the indicator used, the Russian Federation is in the top 5 trading jurisdictions doing the most harm.
- Whether China and Indonesia share this dubious distinction with Russia depends merely on how one interprets the former two countries appearing in joint fourth or fifth place on some of the indicators!
- Argentina is in the top 10 on all 4 indicators.
- Among the industrialised countries, Germany, the UK and the US are in the top 10 worst offenders on 3 of the 4 indicators.
Table 1 Which countries have inflicted the most harm?
Note: There is no single metric to evaluate harm in the GTA database. Different policy measures affect different numbers of products, economic sectors, and trading partners. The GTA reports four measures of harm, see below.
On several indicators then, these 7 countries appear to stand out in terms of their discriminatory response to the global economic downturn experienced during the past 12 months.7
Bad, but not a repeat of the 1930s
Table 1 also implies that, however widespread is the harm done by contemporary protectionism, it is unlikely to have been as far-reaching as its 1930's counterpart. For only 4 nations is the percentage of tariff lines affected by their state's discrimination equal, or in excess of, 25%. Across-the-board tariff increases were not a general feature of the past 12 months.
Victims of crisis-linked murky protectionism
Table 2 reports information on the 10 jurisdictions whose foreign commercial interests have been harmed the most during the past 12 months by others, and the number of jurisdictions responsible for that harm.
Table 2 Top 10 most targeted jurisdictions.
Source: GTA database.
At first glance the table's contents would appear to support the hypothesis that China's foreign commercial interests have been singled out during the recent global economic downturn.
- China's foreign commercial interests have been harmed 141 times, with 59 of its trading partners being responsible for this harm; both figures far exceed those of other nations.
- No other developing country appears in the list of 10 most harmed jurisdictions.
Interpreting crisis-era protectionism
Since the GTA started producing reports – in particular the numerical measures reported above – a number of thoughtful observers have wondered how best to interpret this evidence. Some have worried about the appropriate benchmark from which to compare the discrimination observed over the past 12 months (Messerlin 2009). Here are the main critiques and replies:
Critique: One reaction has been to argue that contemporary discrimination is not as bad as during the 1930s, often with the implication that today's protectionism is not a concern.
Reply: The first part of the claim is almost surely correct (see above), but it doesn’t imply the second part. Just because a pot of water isn't boiling doesn't mean that it's cold; indeed, many temperatures in between can cause great harm.
Critique: Another reaction is to argue that the proper benchmark is the "typical" rate of protectionism witnessed before the crisis. For some, the zero benchmark implied by a literal reading of the G20 declarations is too stringent (Messerlin 2009). On this view contemporary protectionism should be compared to the "routine" total number of tariff increases and reductions. Messerlin (2009) embraces a 4% figure for the routine number of tariff-line changes.
Reply: Leaving aside for the moment the possibility that what is routine may vary across countries, which, if any, countries in the GTA database have seen discriminatory policy changes affecting 4% or more of tariff lines? It turns out that at least 14 nations meet this criterion for the past 12 months. The 14 nations include China, India, Indonesia, Russia, Turkey, the USA, the UK, Germany, France, and Japan; in other words, just about every major emerging market and industrialised country! On the basis of this evidence, protectionist dynamics were far from typical in the major trading powers during the past 12 months.
As far as the propensity to impose discriminatory measures and the propensity to be targeted by the discriminatory measures are concerned, taking account of the huge variation in national exposure to international commerce may be called for. It could be, for example, that large exporters, such as China, are targeted more often precisely because of their pre-crisis presence in world markets. Likewise, countries that import more goods and services may impose more measures against such commerce.
Statistical tools can be readily employed to ascertain whether, having controlled for engagement in international trade, a country is unusually prone to imposing (or to being the target of) discriminatory measures. Using the most recently-available pre-crisis comparable data, the author was able to confirm that the number of discriminatory measures imposed increases with total national imports (and with total national incomes).8 Whatever the control variable, Argentina and the Russian Federation still have an unusually high propensity to impose discriminatory measures. As for the propensity to be targeted, this rises in line with total exports and total national income. Interestingly, once the impact of scale is washed away, there is no evidence that China or any of the other top 10 most targeted countries (reported in Table 2) are specifically targeted by their trading partners.
What it means for protectionist dynamics
Taken together, what does the GTA evidence and the analysis mentioned above imply for the interpretation of contemporary protectionist dynamics? Five conclusions follow:
- Since the first G20 crisis-related summit in November 2008, the largest trading nations have undertaken above-trend levels of discrimination against foreign commercial interests.
- Unlike previous recessions, during the sharp global economic downturn of the past 12 months, by far the most frequently used form of protectionism was financial bailouts, mainly to the manufacturing sector. Across-the-board tariff increases have been very rare; tariff increases themselves only account for one-seventh of all discriminatory measures.
- The next 6-12 months are likely to see a return to a resort to trade remedies, which is the traditional discriminatory tool used in recent recessions.
- Argentina and the Russian Federation have imposed far more discriminatory measures than their exposure to imports would suggest. In contrast, while China, Indonesia, Germany, the UK, and the USA impose a lot of discriminatory measures, the levels of such measures are not out of line with their propensity to import and their economic size.
- The extent to which a nation's commercial interests are targeted by other trading partners is well accounted for by its total exports and national income. This is particularly true of the most targeted nations.
Implications for quantifying the impact of discriminatory state measures
Some words of caution are in order in conducting and interpreting studies of the impact of contemporary state discrimination against foreign interests on commercial flows.
One risk is that some analysts might charge ahead with what little data is available and produce findings that could well be overturned later.
Readily available tariff and bilateral trade data may make it irresistible for some to focus on the impact of recent tariff changes to the exclusion of everything else. Worse, they might compare the impact of tariff changes now with estimates from previous eras, without taking into account that recent tariff changes have quite probably played a smaller role in contemporary protectionism than, say, in the 1930s. Only 1 in 7 of the implemented measures in the GTA database is a tariff change. It seems unwise to characterise the impact of the unusual pattern of contemporary protectionism using a trade policy instrument that is simply not representative of this era's interventions. Estimates of the impact of tariff changes require substantial caveats. Readers beware.
Implied by the last paragraph is the suggestion that a satisfactory account of the impact of contemporary protectionism is going to require estimates of the impact of the various forms of subsidy and financial assistance offered to the manufacturing industry. This in turn will require an understanding of the effects of different forms of subsidy on welfare, trade flows, and the exit of firms. The latter is particularly important for, as noted by some industrialists, contemporary subsidies may have forestalled capacity reduction and, in so doing, potentially sustained trade. This is in direct contrast to raising tariffs, where typically the impact is to reduce imports.
It may well be the case that contemporary state aids have mitigated the fall in international commerce while they simultaneously reduced national economic wellbeing. This is an unwelcome thought for those analysts who implicitly assume that expanding trade and welfare improvements go hand in hand.
Worse, the likely changes in the composition of discriminatory instruments over the next 12 months imply that any satisfactory explanation of contemporary discrimination and associated research strategy will have to consider the possibility that most influential discriminatory policy instruments changed during the global economic downturn and its subsequent recovery. Thus, the time contingency of any current findings is a concern.
Finally, readers should be aware of the "political value" of small estimates of the impact of contemporary protectionism, generated by the selective examination of discriminatory measures undertaken by governments. Analysts might well wonder whose interests – commercial, bureaucratic, etc – are served by the production of small estimates, and in particular if their successful marketing encourages the media and others to shine the torch away from the murkier, contemporary forms of protectionism.
Footnotes
1 The GTA was launched on 8 June 2009. Information on state measures that might have implications for foreign commercial interests are reported on the GTA's website. In its short lifespan the results of the GTA have been mentioned in over 100 newspaper articles and media reports. A substantial report was published before the G20 Summit in Pittsburgh in September 2009, see Evenett (2009a). As of 23 November 2009, the number of users of the GTA website that have returned 9 or more times exceeded 4,500, suggesting widespread usage of the information contained therein.
2 To get some sense of the extent of the update it may be useful to know that in mid-September 2009, prior to the Pittsburgh G20 summit, the GTA database contained reports on 428 state measures.
3 These interests are taken not just to be imports and exports, but also foreign direct investments, foreign workers, and foreign-owned intellectual property. For a description of the methodology employed in constructing the GTA's database, see section 2 of Evenett (2009b).
4 Readers can easily replicate most of the statistics reported in this section by using the "statistics" page of the GTA database.
5 Lowering tariffs on intermediate goods, raw materials, and other non-finished goods may well increase the effective rate of protection of some domestic producers. Care is needed here in interpreting state measures.
6 In this regard, for more on the foolishness of making the perfect the enemy of the very good see Evenett (2009b).
7 Although the four top 10 rankings of harm differ, further investigation revealed strong positive correlations all indicators of harm (correlation coefficients between 0.40 and 0.66).
8 Using raw measures of harm for rankings across all countries, correlation coefficients are between 0.65 and 0.81. Thus the key conclusion does not rely on any one indicator of harm.
9 These econometric estimates are available upon request.
References
Evenett (2009a). Simon J. Evenett (eds). Broken Promises: The Second GTA Report. CEPR. September.
Evenett (2009b). Simon J. Evenett. "What can be learned from crisis-era protectionism? An Initial Assessment." Business & Politics. October.
Messerlin (2009). Patrick Messerlin. "The World Trade Regime, The WTO, and Large Scale Crises: Perspectives After the Pittsburgh Summit." Paper presented at the Fifth ARTNeT conference, Trade-Led Growth in Times of Crisis. Bangkok. October.


