Since well before the crisis, many OECD economies have been confronted with sluggish productivity growth. In the aftermath of the crisis, job creation has also stalled and has become an important policy issue. Business dynamics are at the core of the creative destruction process. Available evidence points to significant cross-country heterogeneity in the dynamism of businesses, even after taking into account differences in sectoral composition. This raises policymakers’ interest in understanding the role of framework conditions in this area. One of the most striking, well-established empirical facts in this respect is the central role of young firms in creating jobs, as shown for instance for the US by Bartelsman et al. (2009) and Haltiwanger et al. (2013), and for India by Ghani et al. (2011). However, we also know that young firms react much more strongly to local income shocks (see evidence for the US by Adelino et al. 2014).
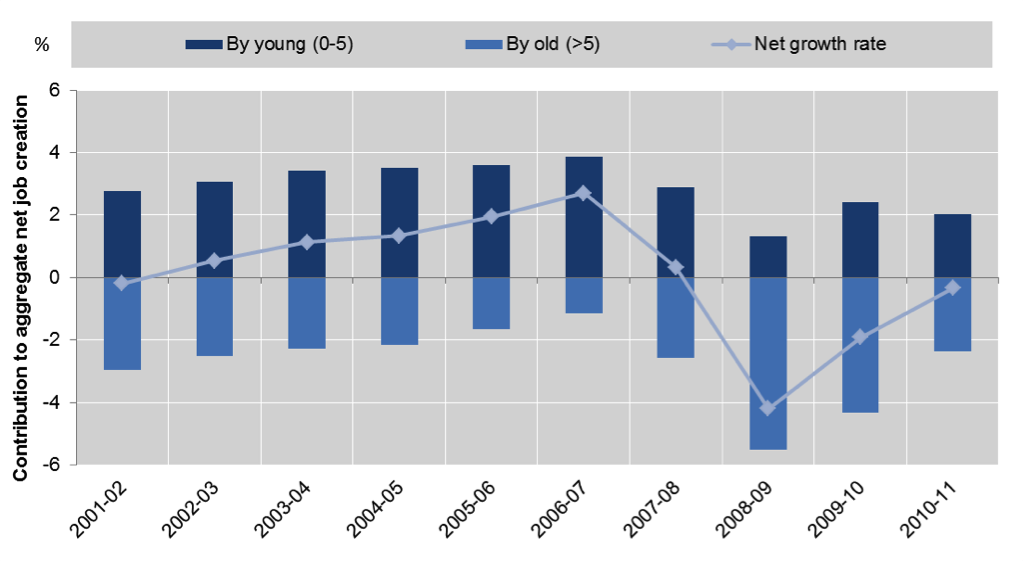
New OECD work (Criscuolo et al. 2014) builds and analyses a novel database from harmonised micro-aggregated firm-level information from national business registers to provide new cross-country evidence on the contribution of firms at different ages and sizes to job creation. The DynEmp database contains information on gross job creation and gross job destruction for different groups of firms classified according to size, age, and sectoral dimensions, across 18 countries and over the last ten years. The analysis confirms that young firms (five years of age or younger) are the primary source of job creation in all 18 countries over most of the 2000s (Figure 1). This is driven to a large extent by the entry of new start-ups as well as higher growth rates of young firms that survive.
The new DynEmp dataset also highlights that the Great Recession has hit young firms more than older firms, affecting both their job creation and job destruction rates, with the fall in hiring by start-ups explaining most of the observed drop in young firms’ job creation. However, the contribution to net employment growth of start-ups and young firms remained positive during the crisis, confirming their importance for job creation throughout the business cycle – while most of the employment losses came from the contraction of older businesses (see again Figure 1). All these findings are confirmed by the econometric analysis, controlling for sector and country-year dummies.
Figure 1. Young firms are net job creators throughout the cycle – contributions to aggregate net job creation by firm age
Source: Criscuolo, Gal, and Menon (2014).
Notes: Average across all available countries. Contributions are calculated as net job creation by the group over total average employment. The period covered is 2001–2011 for Belgium, Finland, Hungary, the Netherlands, the UK, and the US; 2001-2010 for Austria, Brazil, Spain, Italy, Luxembourg, Norway, and Sweden; 2001-09 for Japan and New Zealand; 2001-07 for France; and 2006-2011 for Portugal. Sectors covered are: manufacturing, construction, and non-financial business services. Owing to methodological differences, figures may deviate from officially published national statistics. For Japan, data are at the establishment level; for other countries at the firm level.
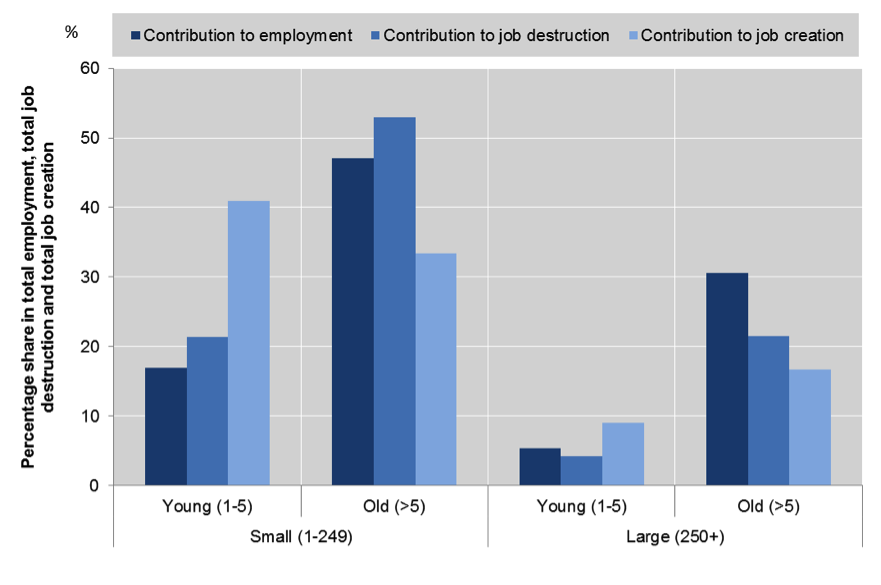
While this finding partly reflects the larger weight of old businesses in the economy and as such does not come as a surprise, it is important to note that the contribution of older firms to gross job destruction is remarkably larger than their share in total employment. Indeed, the contribution to gross job creation by young firms is disproportionally higher than their share of employment (Figure 2), irrespective of their size. Although some cross-country differences persist across countries in the exact definitions of entry, despite extensive harmonisation efforts, the disproportionate contribution of young firms to employment creation emerges across all economies and years considered, and in manufacturing and services alike.
Figure 2. Young firms contribute disproportionately to job creation – employment, job creation, and job destruction by firm age and size
Source: Criscuolo, Gal, and Menon (2014).
Notes: The graph reports the contribution to total employment, gross job creation, and job destruction by firms in the reported age-size groups on average across all available years and countries. Data for Canada refer only to organic employment changes, and abstract from merger and acquisition activity. See also notes to Figure 1.
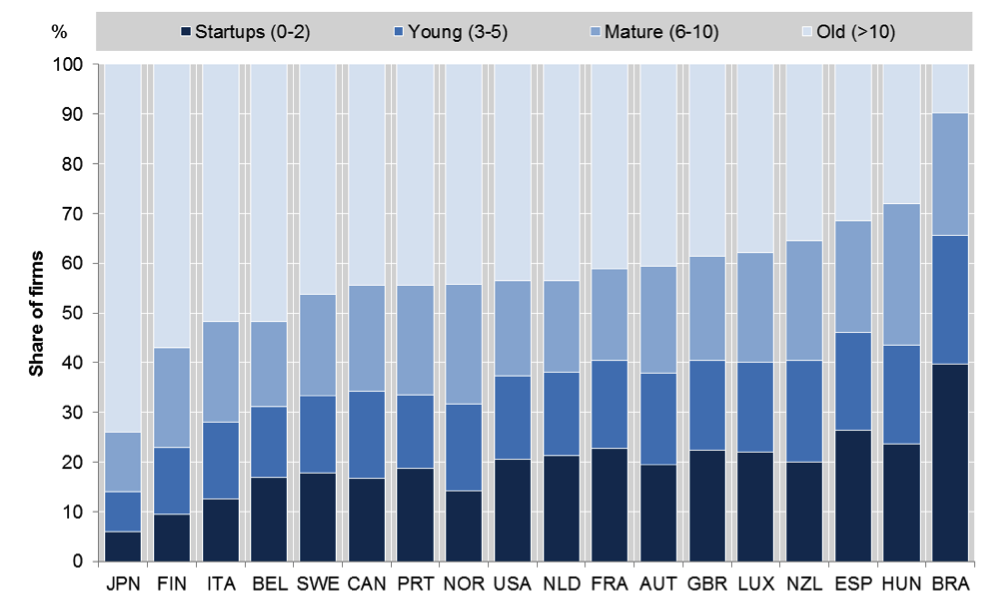
These findings underscore the importance of considering the age dimension of firms. For instance, the economic literature on resource misallocation suggests that a large employment share of small businesses, which tend to be less productive than larger businesses, might reflect an inefficient allocation of resources in the economy (e.g. Restuccia and Rogerson 2013, Hsieh and Klenow 2009, Bartelsman et al. 2013). However, most of these studies ignore systematic cross-country differences in the age profile across firms of different sizes. These differences can be significant – as shown in Figure 3, the age profile of small businesses is very different across economies.
A well-functioning economy needs constant reallocation of resources
The disproportionate contribution of young firms to gross job creation has to be considered in conjunction with the ‘up-or-out’ dynamics typical of young firms, where high average rates of post-entry growth for incumbent young firms co-exist with low survival rates for firms in this age group (see Haltiwanger et al. 2013 for evidence from the US, and Anyadike-Danes et al. 2013 for evidence from six European countries). Differences in these dynamics likely reflect the extent to which young firms are willing to experiment and are able to shed jobs. These can vary significantly across countries and sectors and over time, depending on the nature of the activity of the firms, the uncertainty of demand and the business environment, and on features of the policy framework, such as regulatory barriers, employment protection, and bankruptcy legislation.
Figure 3. Age composition of small businesses – average over time, firms below 50 employees
Source: Criscuolo, Gal, and Menon (2014).
Notes: The graph shows the share of firms by different age groups in the total number of micro and small firms (below 50 employees) in each economy on average over the available years. See also notes to Figure 2.
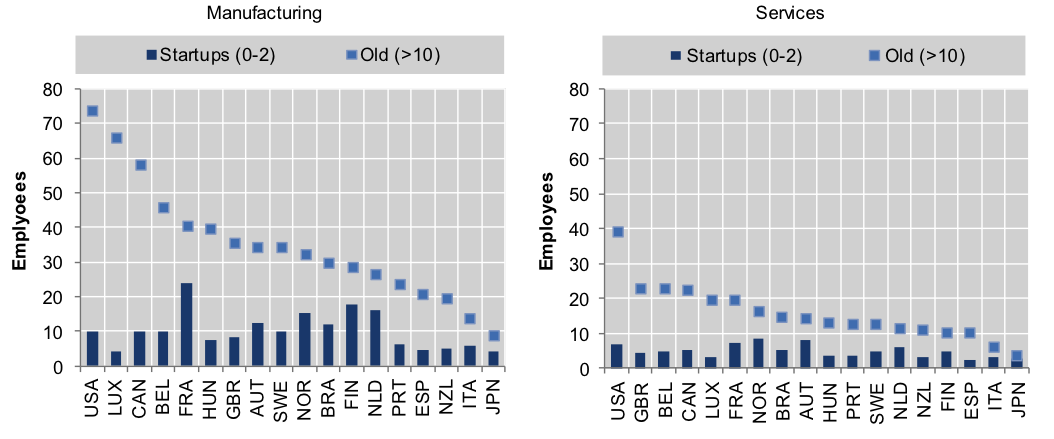
The project provides indirect evidence on the potential contribution of young firms to growth across different countries by taking a snapshot of the differences in the average size of start-ups and old businesses. As Figure 4 shows, differences in the size of start-ups at entry exist but are not striking, but much larger differences emerge when considering older businesses – on average, the size of an old manufacturing business in France is half the size of its equivalent in the US.
This suggests that in some countries there are lower barriers to entry; as a consequence, start-ups can start at a smaller size, which leaves more room for experimentation. This, in turn, can contribute to unleashing the growth potential of successful ventures, partly explaining the differences in the size of mature businesses. It also indicates that in some countries barriers to growth might play an important role in hindering the growth potential of young firms.
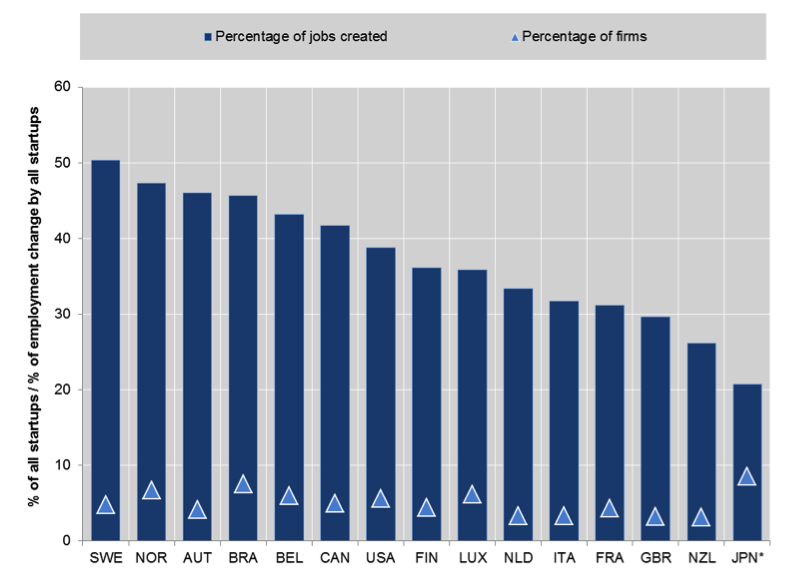
The primary role played by experimentation is also reflected in Figure 5, reporting the share of micro (fewer than ten employees) start-ups that grow above 10 employees over a three-year period, and the share of net job creation that they contribute to. Although very few micro start-ups – about 2% to 9% – grow above ten employees, the contribution to net job creation by all micro start-ups ranges from 21% (in Japan) to 50% (in Sweden).
Figure 4. Average size of start-ups and old firms across industries and across countries
Source: Criscuolo, Gal, and Menon (2014).
Notes: The graph reports the average size of start-up firms (from 0 to 2 years old) and firms more than 10 years old, as the average over the available years. See also notes to Figure 2.
Figure 5. Growing start-ups – percentage of all start-ups and contribution to start-up net job variation, 2001–2010
Source: OECD DynEmp database.
Notes: Growing start-ups are firms with fewer than ten employees at the age 0 to 2 with grow over ten employees over a three-year interval. See also notes to Figure 2.
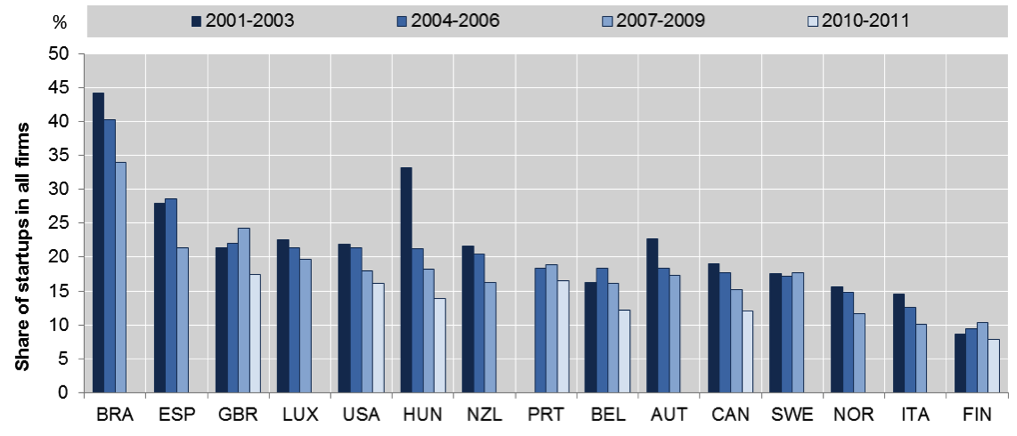
Across all countries, however, the share of start-ups had already been steadily decreasing before the crisis, with the Great Recession having an additional negative impact on start-up rates. These results align with recent evidence from the US that finds a significant decline in business dynamism in the US over the last 30 years, the reasons for which remain uncertain (Decker et al. 2013, Hathaway and Litan 2014).
Figure 6. Declining start-up rates – percentage of start-ups in all businesses
Source: Criscuolo, Gal, and Menon (2014).
Notes: The graph reports start-up rates (defined as the fraction of start-ups among all firms) by countries, averaged across the indicated three-year periods. Start-up firms are those firms that are from 0 to 2 years old. See also notes to Figure 2.
Public policy plays a crucial role
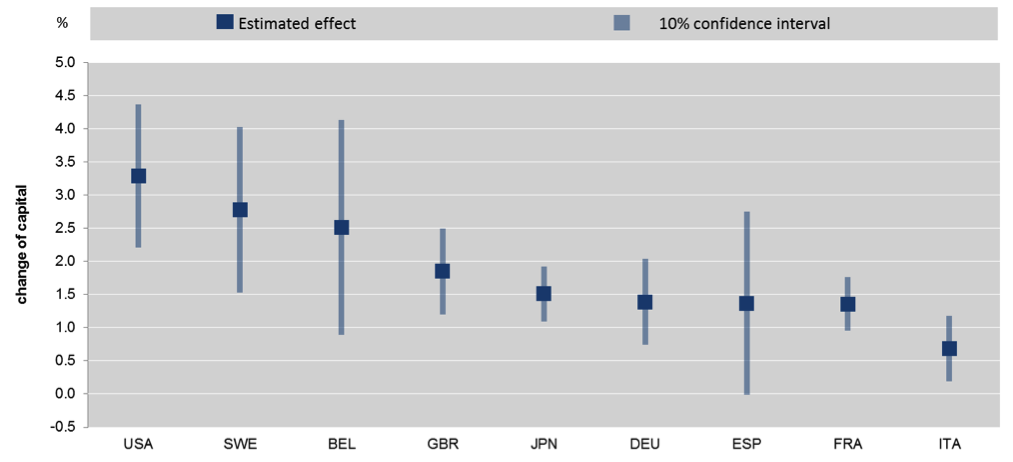
Significant cross-country differences exist in the degree to which resources flow to their most productive use. For instance, a recent OECD study (Andrews et al. 2014) using firm-level data finds significant heterogeneity across countries in the extent to which patenting firms can attract the complementary tangible resources that are required to implement and commercialise new ideas. As shown in Figure 7, the extent to which capital flows to patenting firms in the US is estimated to be more than twice as large as France and Germany, and four times as large as in Italy.
The analysis also suggests that public policies can have important effects on the efficiency of resource allocation. Well-functioning product, labour and capital markets, and efficient judicial systems and bankruptcy laws that do not overly penalise failure can raise the returns to innovative activity. Young firms – which are more likely to experiment with disruptive technologies and rely on external financing to implement and commercialise their ideas – may disproportionately benefit from reforms to labour markets and more developed markets for credit and seed and early-stage finance.
Figure 7. Do resources flow to patenting firms? Change in capital stock associated with a 10% change in patent stock, selected OECD countries (2003–2010)
Source: Andrews, Criscuolo, and Menon (2014).
Notes: The black dot shows the country-specific point estimate of a panel fixed-effect regression at firm level of capital stock on patent stock, while the grey bands denote the 90% confidence interval.
These findings are consistent with OECD analysis on the heterogeneous impact of policies and institutions at different points of the firm-level growth distribution across sectors and eleven OECD economies (Bravo-Biosca et al. 2013). The results confirm that some policies disproportionally affect specific groups of firms – e.g. high-growth, stable, or shrinking firms – being linked to either a more stagnant or dynamic employment growth distribution in the economy.
In particular, more developed financial institutions are associated with a widening and flattening of the growth distribution in industries that are highly dependent on external finance, while stringent employment protection legislation leads to a less dynamic (i.e. narrower) firm growth distribution. The tightness of a bankruptcy regime also impacts the shape of the growth distribution, although the results reflect the trade-off between creditors’ insurance and stricter credit conditions. Finally, more generous R&D fiscal incentives are correlated with a narrower growth distribution in R&D-intensive sectors, with significantly fewer shrinking firms and more stable firms, while firms at top of the distribution experience relatively lower growth. The results also suggests that R&D fiscal incentives may have the unintended consequence of protecting incumbents and slowing down the reallocation of resources towards more innovative entrants.
Authors’ note: The article should not be reported as representing the official views of the OECD or of its member countries. The opinions expressed and arguments employed are those of the authors.
Footnotes
1. The evidence described in this article is based on the first round of an ongoing data collection project called ‘OECD DynEmp’, which relies on the active collaboration of a network of researchers and experts across OECD and non-OECD economies. See: http://www.oecd.org/sti/dynemp.htm.
2. This is consistent with evidence reported by Lee and Mukoyama (2008), who look at the ‘cleansing’ effects of recessions. Using data on the US manufacturing sector, the authors find that entry is higher in booms than busts, while exit rates are steady over the cycle. Plants entering during recessions, however, are larger and more productive.
References
Adelino M, S Ma, and D Robinson (2014), “Firm age, investment opportunities, and job creation”, VoxEU.org, 12 February.
Andrews D, C Criscuolo, and C Menon (2014), “Do resources flow to patenting firms? Cross-country evidence from firm-level data”, Economics Department Working Papers, OECD, forthcoming.
Anyadike-Danes, Michael, Carl Magnus Bjuggren, Sandra Gottschalk, Werner Hölzl, Dan Johansson, Mika Maliranta, Anja Grinde Myrann (2014) “Accounting for Job Growth: Disentangling Size and Age Effects in an International Cohort Comparison”, IFN Working Paper 1019.
Bartelsman, E, J Haltiwanger, and S Scarpetta (2009), “Measuring and analysing cross-country differences in firm dynamics”, in Dunne, Bradford, and Roberts (eds.), Producer dynamics: New evidence from micro data, University of Chicago Press.
Bravo-Biosca, A, C Criscuolo, and C Menon (2013), “What Drives the Dynamics of Business Growth?”, OECD Science, Technology and Industry Policy Papers, No. 1.
Criscuolo C, P N Gal, and C Menon (2014), “The dynamics of employment growth: new evidence from 18 countries”, OECD Science, Technology and Industry Policy Papers, forthcoming.
Ghani, Ejaz, William Kerr, and Stephen D O'Connell (2011), “Who creates jobs? New evidence from India”, VoxEU.org, 4 December.
Haltiwanger, J, R S Jarmin, and J Miranda (2013), “Who Creates Jobs? Small Versus Large Versus Young”, Review of Economics and Statistics, 95(2): 347–361.
Hathaway, I and R E Litan (2014), “Declining Business Dynamism in the United States: A Look at States and Metros”, Brookings Economic Studies, May.
Hsieh, C and P J Klenow (2009), “Misallocation and Manufacturing TFP in China and India”, Quarterly Journal of Economics, 124(4): 1403–1448.
Lee, Yoonsoo and T Mukoyama (2008), “Are there cleansing effects of recessions? Entry and exit of manufacturing plants over the business cycle”, VoxEU.org, 7 January.
Restuccia, D and R Rogerson (2013), “Misallocation and productivity”, Review of Economic Dynamics, 16(1): 1–10.


