In several European countries, about 10% of the population is born outside of Europe.1 This mix of individuals has posed, and continues to pose, challenges. For example, immigrants in Europe born outside of Europe earn about 77% of what native Europeans do (a median net income of €12,258 versus €15,830), and their unemployment rates are almost twice as high (18.8% versus 9.5%). The achievement gap between native Europeans and immigrants persists for second-generation immigrants, who are born and typically trained in the country of residence. Second-generation immigrants in Europe are almost twice as likely to be unemployed if both parents have a foreign background than individuals with native-born parents. In some countries, including Germany and the Netherlands, the youth unemployment rate of second-generation immigrants in the 25-34 age range is close to three times as high. There are several factors that potentially underlie this gap (including employers being uncertain about skills and education acquired abroad, language problems and the specific socio-demographic composition of the immigrant population), and ethnic discrimination is one of these.
Field experiments have shown that ethnic discrimination is a reality, not just a perception, in many European (and other) countries (Bertrand and Duflo 2016, Guryan and Charles 2013, OECD 2013). Audit studies where actors of different ethnic origins participate in job interviews typically find that interviewees from ethnic minorities are less likely to be called back, and if called back, are less likely to be hired. Likewise, in correspondence studies, CVs that are sent in response to job vacancies have a lower callback rate if the name of the applicant is from an ethnic minority, even if all the other elements in the CV are the same.
Sources of discrimination
Discrimination observed in field experiments can be the result of ‘stereotypes’ or of ‘tastes’. Stereotyping may occur in a context of ‘behavioural risk’. If the decision maker has little information about how a person will act, he may form expectations by relying on general information about the group to which this person belongs. To illustrate, an employer who sees many immigrants being unemployed may believe that immigrants are less productive than workers from the native majority, and may therefore be reluctant to hire an immigrant. Discrimination driven by tastes stems from a dislike of ‘the other’, because it persists even if there is no behavioural risk (Becker 1957). It may lead to economic inefficiencies, for example by distorting the allocation of talent.
Understanding the nature of discrimination is key for understanding how it can be tackled. Given that field data are inherently noisy and almost always characterised by behavioural risk, a difficulty in empirical research is to identify the type of discrimination involved. In a recent study, we overcome this problem by using a controlled experiment that isolates discrimination driven by tastes (Cettolin and Suetens (2017). In what follows we give a summary of the methods and results.
The experiment: Binary trust games
Participants in the experiment made decisions in the role of trustor or trustee in binary trust games. A trust game captures key features of social and economic interactions where, most of the time, not everything can be covered by a contract (for example, employer-employee interactions and friendship or neighbour relations). These types of relationships can only be successful if cooperation is mutual – whereas trust is essential for the functioning of societies, in the long run it cannot exist without trustworthiness.
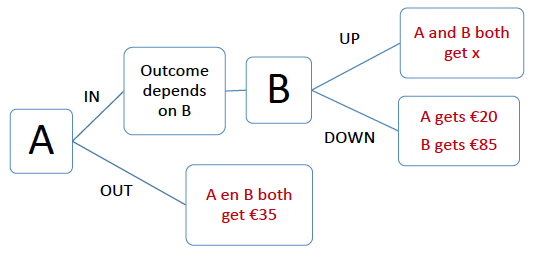
The decision environment used in the experiment is shown in Figure 1. Player A decides whether to go ‘in’ or ‘out’. Player B decides whether to go ‘up’ or ‘down’. If A goes ‘out’, the decision of B is inconsequential, and both earn €35. If A goes ‘in’, earnings depend on B’s choice. If B goes ‘down’, A gets €20 and B gets €85. If B goes ‘up’, both get an amount of x where x is equal to €40, €60 or €80 corresponding to low, medium, or high ‘gains of cooperation’, respectively. Player A is referred to as the trustor because the act of going ‘in’ (‘out’) corresponds to (not) trusting player B. Player B is the trustee who can act cooperatively by reciprocating A’s trust (‘up’) or can let A down.
Figure 1 Binary trust game
The experiment was run with participants recruited from the Longitudinal Internet Studies for the Social Sciences panel, which constitutes a representative sample of about 8,000 people living in the Netherlands. Our focus is on the choices of a random sample of people drawn from the panel who made decisions in the role of trustee (player B in Figure 1). The reason why our focus is on the trustees is that – in contrast to the decision to trust – the decision to reciprocate does not involve behavioural risk, and is therefore mostly driven by tastes. The trustees were all native Dutch (N = 691), and they were randomly paired with a native Dutch trustor (N = 329) or with a ‘non-Western’ immigrant (N = 362). In order to create awareness of the matched person’s ethnic identity, his or her first name was revealed (as in Bouckaert and Dhaene 2004 and Fershtman and Gneezy 2001).
The behavioural data obtained in the experiment were linked to self-reported political attitudes and values, independently collected in a survey among (almost) all panel members a year before the experiment took place. An index was distilled using six items of this survey that relate to attitudes towards immigrants and ethnic diversity in society. Based on this index, participants in the experiment are divided into two groups using a median-split: trustees who self-report a negative attitude to immigrants, and trustees who self-report a positive attitude to immigrants.
Results
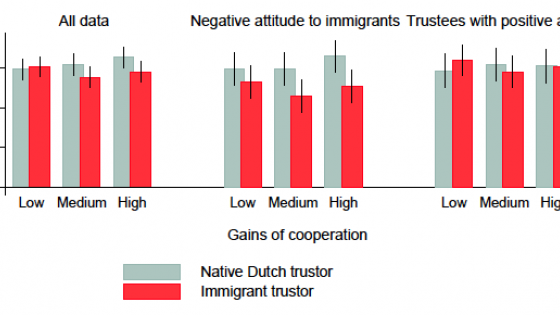
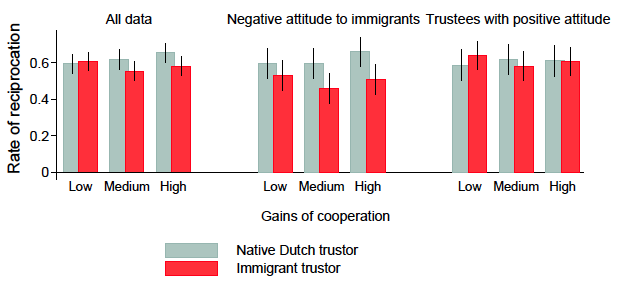
Overall, trustees in the experiment reciprocate trust of immigrants about 4.5 percentage points (8%) less frequently than trust of other native Dutch participants. The reciprocation rate is 57.5% for trustees paired with an immigrant and 62% for trustees paired with another native Dutch person. As can be seen in the left panel of Figure 2, the difference comes from cases where gains to cooperation are relatively high. In these cases, trust of immigrants is reciprocated 7-8 percentage points (about 12.5%) less frequently than trust of native Dutch.
Figure 2 Reciprocation rate of native Dutch trustees
Notes: The figure shows reciprocation rates of native Dutch trustees and estimated 95% confidence intervals. Grey (red) bars indicate reciprocation rates when the matched trustor is native Dutch (an immigrant). The left panel refers to all of them. The middle panel refers to trustees who tend to have a negative attitude towards immigrants. The right panel refers to trustees who tend to have a positive attitude towards immigrants.
Does behaviour in the experiment align with self-reported attitudes to immigrants? The answer is yes. Trustees who tend to think negatively about immigrants reciprocate trust of an immigrant up to 14 percentage points (more than 20%) less frequently than trust of a native Dutch participant. In contrast, trustees with a positive attitude do not condition their decision on the ethnic identity of the trustor. This can be seen in the middle and right panels of Figure 2.
Conclusion
Native Dutch people are less trustworthy when the person who trusts them is an immigrant of non-Western descent than when this person is native Dutch. Since trustworthiness involves no behavioural risk, this suggests that discrimination is not only the consequence of stereotyping but also of tastes. In the worst possible case for immigrants – that is, when gains from a mutually cooperative relation are potentially highest and when the decision maker tends to think negatively about immigrants – the likelihood that their trust is reciprocated is more than 20% lower than for native Dutch participants.
The Netherlands is of course just one country in the EU. There are reasons to believe, though, that behaviour in the same decision-making context would have been discriminative also in other countries. In several EU countries, the economic and social position of ethnic minorities is similar to – or sometimes even worse than – that in the Netherlands. More research is needed to draw a more complete picture.
References
Becker, G (1957), The economics of discrimination, Chicago: University of Chicago Press.
Bertrand, M and E Duflo (2017), “Field experiments in discrimination”, in Banerjee, A and E Duflo (eds.), Handbook of economic field experiments, Amsterdam: Elsevier, North-Holland.
Bouckaert, J and G Dhaene (2004), “Inter-ethnic trust and reciprocity: Results of an experiment with small businessmen”, European Journal of Political Economy 20(4): 869-886.
Cettolin, E and S Suetens (2017), “Return on trust is lower for immigrants”, CEPR Discussion Paper 12244, forthcoming in Economic Journal.
Fershtman, C and U Gneezy (2001), “Discrimination in a segmented society: An experimental approach”, Quarterly Journal of Economics 116(1): 351-377.
Guryan, J and K K Charles (2013), “Taste-based or statistical discrimination: The economics of discrimination returns to its roots,” Economic Journal 123(572): 417-432.
OECD (2013), “Discrimination against immigrants – measurement, incidence and policy instruments”, in International Migration Outlook, p. 191-230, Paris: OECD Publishing.
Endnotes
[1] The statistics cited in this paragraph come from http://ec.europa.eu/eurostat/statistics-explained/index.php/Migrant_integration_statistics, http://www.oecd.org/publications/indicators-of-immigrant-integration-2015-settling-in-9789264234024-en.htm and http://www.oecd-ilibrary.org/social-issues-migration-health/international-migration-outlook-2014_migr_outlook-2014-en.


