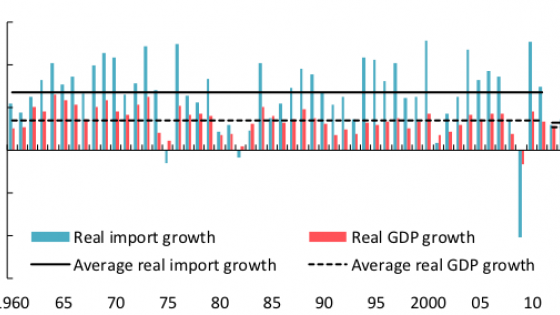
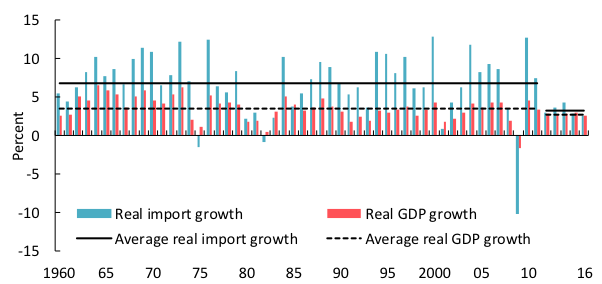
Global trade growth has slowed significantly in recent years. Since 2012, the volume of world trade in goods and services has grown by just over 3% a year, less than half the average during the previous three decades. The slowdown is remarkable both in absolute terms and when set against the historical relationship between growth in trade and global economic activity (Figure 1).
Figure 1. World real trade and GDP growth in historical perspective
Notes: Imports include goods and services. 2016 data are based on projections as of October. Annual aggregate import (GDP) growth is calculated as the weighted average of country-specific real import (GDP) growth rates, where nominal import (GDP at market exchange rates) shares are the weights used.
October 2016 WEO chapter 2 in a nutshell
In Chapter 2 of the October 2016 IMF World Economic Outlook (IMF 2016), we explore the reasons for the weakness in trade, which is particularly pronounced in the exchange of goods and widespread across countries and products. Is this deterioration in goods trade simply a symptom of the weak economic environment, or can some of the growth slowdown be attributed to the slowing pace of trade liberalisation, a rise in trade-constricting policies, or changes in global value chains?
We employ three complementary analytical approaches to answer these questions. We first use a standard empirical model of demand for import goods to determine whether import growth at the country level has slowed by more than changes in aggregate demand components and relative prices would predict in recent years. Following Bussière et al (2013), we proxy import demand with the import-intensity-adjusted aggregate demand – a weighted average of investment, private and government consumption, and exports – to account explicitly for differences in the import content of the various aggregate demand components, and to capture the effect of changes in the overall strength of economic activity and across its drivers. The latter is especially important. Investment, together with exports, has a particularly rich import content, and it has remained weak in many advanced and emerging markets and developing economies since the global financial crisis.
In our preferred specification, we improve on the Bussière et al (2013) framework, and use external demand predicted by trading partners’ domestic demand, rather than actual exports, to construct countries’ import-intensity adjusted demand. This extension allows us to more consistently aggregate predicted changes in trade driven by domestic demand at home and in trading partners, given the global nature of the trade slowdown. A single country can take external demand for its goods as given, but for the world as a whole only the sum of individual countries’ domestic demands determines global trade growth.1
An even more suitable way to capture the synchronised nature of the trade slowdown across countries is through the lens of a structural multi-country, multi-sectoral model of trade. In our second approach, we estimate a general equilibrium model adapting Eaton et al. (2010, 2016), which quantifies the importance of changes in the composition of demand and other factors, such as trade costs – broadly defined – in a global setting.2 The general equilibrium approach has an additional advantage as it allows the level of economic activity to respond endogenously to changes in trade patterns and trade costs, through their effects on prices of intermediate and consumption goods. This is a channel our empirical model was unable to capture.3
The third part of our analysis uses highly disaggregated sector-level data to shed light on the role of trade policies and global value chain participation using a detailed new dataset of product-level trade volumes. Specifically, we analyse the historical relationship between disaggregated trade flows and measures of trade policy and participation in global value chains at the country-product or country-sector level, and use the estimated elasticities to establish how much each potential factor can account for in the slowdown in trade growth during 2012-15.
The key findings of the chapter are as follows:
- Slow trade volume growth in goods is to a significant extent a symptom of the sluggish economic recovery across the globe and the changes in the composition of economic activity.
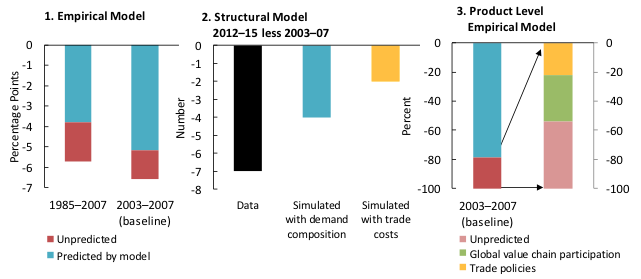
The empirical model of import demand, estimated separately for 150 economies with annual data over 1985-2015, suggests that from the perspective of an average individual country, a very large share of the decline in real import growth since 2012 can be traced to weaker investment and subdued export demand. World goods trade volume growth averaged 2.3% in 2012-15, down from 8.1% in 1985-2007 and 8.9% in 2003-07. Our empirical model can predict up to three-fourths of the 6.6 percentage points shortfall in real import growth since 2012 compared with 2003-07 and about 65% of the 5.7 percentage points shortfall compared to 1985-2007. These declines reflect slower overall growth, a change in the composition of economic activity away from more import-intensive components – namely, investment – and the synchronised nature of the growth slowdown across countries, which may be in part affected by trade (Figure 2, panel 1).4 During 2012-15, at the global level, goods import growth rates have fallen short by about 1.5–1.75 percentage points on average, relative to what would be expected based on the historical relationship between trade flows and economic activity.
Figure 2. Decomposing the decline in real goods trade growth in 2012-15
Notes: Panel 1 depicts the actual and predicted change in average real goods import growth between 2012-15 and two alternative benchmark periods based on the empirical model using own and partners’ domestic import-intensity-adjusted demand. Panel 2 plots the change in the average growth of the imports-to-GDP ratio in the data, and the counterfactuals implied by the structural model with demand composition wedge only (blue) and the trade cost wedge only (yellow). Panel 3 reproduces the actual and predicted change in average real goods import growth between 2012-15 and 2003-07 from panel 1, and presents the estimated contribution of changes in trade policies and global value chain participation to the unpredicted component of the slowdown (red) based on the sector-level analysis.
- Changes in the composition of economic activity can account for a sizable share of the decline in nominal trade growth relative to GDP growth.
By taking into account the trade, price, and production patterns of 34 economies, the structural model attributes up to 60% of the decline in the growth of the ratio of nominal goods to GDP in 2012-15 relative to 2003-07 to a shift in demand away from tradables, especially commodities and durable manufactured goods (Figure 2, panel 2). At the same time, trade costs – which, in the model, encompass tariffs, non-tariff barriers, cross-border transportation costs, etc. – play a non-negligible role, accounting for close to a quarter of the slowdown.
- Other factors, however, are also weighing on trade growth.
Our analysis of product-level data reveals that the slowdown in the pace of trade liberalisation and the recent uptick in protectionist measures are holding back international trade in goods, even if their estimated quantitative contribution appears to have been limited during the study period, which ends in 2015. The decline in the growth of global value chains has also played an important part in the observed slowdown (Figure 2, panel 3). Overall, our analysis attributes about three-quarters of the 6.6 percentage points decline in global annual real import growth between 2003-2007 and 2012-2015 to factors beyond the level and composition of economic activity. This estimate is likely a lower bound on the actual contribution of these other factors to the weak trade growth. Because trade costs play an important role in shaping global value chains, productivity, and economic growth, and ultimately import demand, both the empirical analysis and structural model may be underestimating their total contribution to the trade slowdown.
Comparison with other studies
In light of the fast-growing literature on understanding the trade slowdown (e.g. Amiti et al 2016, Borin et al. 2016, ECB 2016, Gaulier et al 2016, Jean 2016, Kindberg-Hanlon and Young 2016, Lewis and Monarch 2016, OECD 2016, Powell 2016, Timmer et al 2016), we address some of the most common questions raised by the findings of the chapter and briefly compare our results with those of others.
Is the chapter’s benchmark period of 2003-07 period too short and special?
Our chapter uses 2003-07 as a benchmark period, which is primarily due to the heavy data requirements of the structural model and product-level empirical analysis. However, the empirical import demand estimations also compare the recent slowdown period against 1985-2007 and find that the results are not very sensitive to the choice of benchmark period. In particular, the chapter finds that weaker economic activity and changes in its composition can predict about 65% of the observed trade slowdown relative to 1985-2007. If 2003-07 is used as the benchmark, weaker economic activity and changes in its composition can predict about three-quarters of the trade slowdown.
Should the import growth to GDP growth ratio (elasticity) be the main object of interest?
The chapter’s empirical analysis focuses on understanding the change in real import growth as opposed to changes in the ratio of import growth to GDP growth. The main reason for this focus is that economic theory offers clear guidance on the factors affecting import demand rather than import growth relative to output growth. Thus, we rely on a broad class of import demand models to derive our empirical specifications, and are careful to proxy import demand at the aggregate level not simply by GDP, as done in many studies, but by an import intensity-weighted average of the main demand components as in Bussière et al (2013). A similar approach was recently used in Kindberg-Hanlon and Young (2016).
What do the chapter’s empirical results imply for the elasticity of trade with respect to GDP?
Economic growth can naturally explain a higher share of the changes in overall import growth than in the elasticity of trade with respect to GDP. This is because changes in the elasticity – that is, the differential between import and output growth – remove differences in output growth by construction. Studies by the OECD and the ECB, which seek to explain changes in this elasticity, attribute about 40 and 50% of its decline, respectively, to weak global activity and its composition.
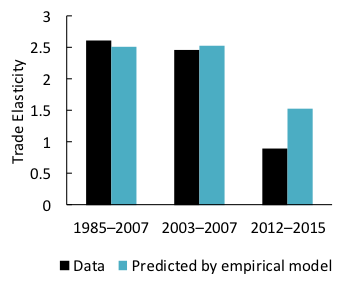
While our dependent variable is absolute rather than relative import growth, the predicted import growth from the empirical analysis can be used to obtain the predicted ratio of import growth to GDP growth (what many refer to as the income elasticity of trade). According to the chapter’s baseline specification, which models import growth as a function of changes in domestic demand and foreign demand as predicted by trading partners’ domestic demand, the predicted ratio of world import growth to world GDP growth fell from 2.52 in 1985-2007 to 1.53 in 2012-15 (Figure 3). The elasticity observed in the data fell from 2.61 in 1985-2007 to 0.89 during the slowdown period. In other words, the empirical model predicts about 58% of the observed decline in the ratio of real import growth to GDP growth between 1985-2007 and 2012-15, which is quantitatively similar to the findings by the OECD and ECB.
Figure 3. Ratio of world real import growth to GDP growth: Actual and predicted
Notes: The ratio of import growth to GDP growth in the data is plotted against those predicted by the empirical model using own and partners’ domestic import-intensity-adjusted demand.
This is also in line with the findings of our structural approach, which examines the drivers of the nominal import-to-GDP ratio. Within this framework, about 60% of the slowdown in nominal import-to-GDP ratio since 2012 relative to 2003-07, can be traced back to changes in the composition of demand.
Does the chapter argue that cyclical factors account for up to three quarters of the slowdown in trade growth between 2003-07 and 2012-15?
Our chapter refrains from categorising various drivers of the slowdown as cyclical or structural and aims merely to quantify their contributions to the slowdown. This is because these underlying factors themselves may have both cyclical and structural components. As the October 2016 WEO highlighted in Chapter 1, the current weak growth indeed has both cyclical and structural roots and a host of policy actions is needed to help lift growth.
Isn’t the increased share of emerging market and developing economies in world GDP an important factor in the decline of the global trade elasticity, since these economies’ trade is typically less responsive to output fluctuations?
Our analysis reveals substantial variation in the income elasticity of goods imports across countries as demonstrated in Annex Table 2.3.3 of the WEO chapter. Advanced economies tend to have a higher income elasticity of goods imports than emerging market and developing countries. Naturally, geographical shifts in activity towards emerging market and developing economies away from advanced economies would lower the elasticity of global trade relative to world GDP as demonstrated by Slopek (2015) and ECB (2016).
However, as mentioned earlier, our study examines whether there is anything unusual in import growth for each country since 2012 when compared to what a simple model of import demand would predict for that country; we do not quantify the effect of geographical shifts in activity on the global income elasticity of trade – the focus of ECB (2016). However, our finding – that the slowdown in trade is, to a significant extent, consistent with the slowdown in economic activity and changes in its composition within a country – does not contradict the findings in ECB (2016) that the decline in the global trade elasticity is, to some extent, a reflection of the geographic shifts in economic activity.5 That said, the widespread decline in the ratio of trade growth relative to GDP growth since 2012 across individual countries –observed in 116 out of the 171 economies analysed in the chapter – suggests that other factors, namely trade policies and global value chain participation, were important as well. Moreover, these factors appeared to have played a more pronounced role in the slowdown in trade observed in emerging market and developing economies. The empirical analysis and structural model attribute a smaller share of the declines in trade growth and in the ratio of trade to income growth to economic activity and its composition in these economies relative to advanced economies, as depicted in Figures 2.7 and 2.8 of the WEO chapter.
How are the chapter’s findings on trade policies different from other studies?
Our chapter finds, as do the analyses in ECB (2016) and OECD (2016), that the trade liberalisation process has stalled and there is more frequent recourse to protectionist measures. The studies, however, differ in the importance they attribute to the waning pace of liberalisation in the current trade slowdown. While our chapter and the ECB study find the quantitative contribution of trade policies to have been limited as of the end of 2015, the OECD notes that the pace of trade liberalisation has been an important factor, explaining about one quarter of the decline of trade intensity.6
The difference in findings reflects both differences in measurement of trade policy and methodology. Our chapter analyses tariffs and non-tariff measures for each country and product as well as free trade agreement coverage at the country level.7 These measures suggest a slowdown in the trade liberalisation process since the second half of the 2000s. The OECD study, on the other hand, relies on an index of global trade liberalisation from the Fraser Institute for Economic Freedom, which implies a significant decline in the degree of liberalism starting in 2000. Furthermore, the OECD study quantifies the role of trade policies in the slowdown by estimating a simple regression of changes in world trade intensity on changes in world trade policies. Our quantification relies on the analysis of real trade and trade policy measures at the product level, which allows us to control for all common factors that have influenced trade flows across countries and products over time, as well as all time-invariant differences in trade levels across country-product pairs.
How are the chapter’s findings on GVC participation different from other studies?
Relative to other studies, the chapter uses the most comprehensive and up-to-date measure of global value chain participation available at the time of publication. Based on this measure, which is available through 2013, and consistent with the findings by the ECB and OECD, there appears to have been a decline in the growth of GVCs during the slowdown period. Our chapter, similar to the ECB study, finds that the slowdown in GVCs has weighed on real trade growth. However, its quantitative contribution is less pronounced than estimated in the OECD study, which attributes half of the decline in the world trade elasticity to the GVC slowdown. As in the case of trade policies, the differences in findings reflect measurement and methodological differences.
The three studies rely on different measures of GVC participation and different data sources. Our measure is based on the gross export accounting of Koopman et al. (2014) and is constructed from the Eora MRIO database updated until 2013. The ECB study relies on a conceptually similar measure developed by Borin and Mancini (2015), which further partitions some subcomponents of domestic value added in a country’s exports based on source, destination, and intermediate processing. These refinements generate minor quantitative differences relative to the measure used in the chapter. Furthermore, the ECB study relies on data from the World Input-Output Database (WIOD) available up until 2011. The OECD study proxies GVC participation with the ratio of intermediate goods to final domestic demand, corrected for cyclicality and commodity price effects, available until 2015. This measure exhibits a much steeper increase in average GVC participation until 2010, and a small decline since. The empirical specifications to tease out the contribution of GVCs to the slowdown also differ, with the OECD relying on a regression of the world trade elasticity on world GVC participation, while our chapter uses product-level data on trade growth and sectoral measures of GVC participation.
Recent work by Timmer et al. (2016) uses the WIOD updated to 2014 to compute a new measure of the import intensity of world GDP that can vary as either production processes become more internationally fragmented or when final demand shifts to goods and services for which production processes are more import intensive. Therefore, the paper attempts to unify both demand-side and production-side explanations for the trade slowdown in a single measure, and the data suggest that both factors appear to drive down import intensity equally between 2011 and 2014. While the paper employs an important and novel approach, its sole reliance on nominal input-output tables leaves it unable to fully account for the role of real activity in determining trade.
Authors’ note: The views expressed here are those of the authors and do not necessarily represent those of the institutions with which they are affiliated.
References
Amiti, M, T Bodine-Smith, C Hottman and L Lewis (2016) “What's driving the recent slump in US imports?”, Federal Reserve Board, IFDP note.
Borin, A, and M Mancini (2015), “Follow the Value Added: bilateral gross export accounting”, Economic Working Papers No. 1026, Bank of Italy.
Borin, A, V Di Nino, M Mancini and M Sbracia (2016) “The cyclicality of the income elasticity of trade”, MPRA Paper, No 73000, August.
Bussière, M, G Callegari, F Ghironi, G Sestieri and N Yamano (2013) “Estimating trade elasticities: Demand composition and the trade collapse of 2008–09”, American Economic Journal: Macroeconomics, 5(3): 118–51.
Eaton, J, S Kortum, B Neiman and J Romalis (2010) “Trade and the Global Recession”, National Bank of Belgium, Working paper research 196, October, Brussels.
Eaton, J, S Kortum, B Neiman and J Romalis (2016) “Trade and the Global Recession”, American Economic Review, 106(11): 3401-38.
European Central Bank, IRC Trade Task Force (2016) “Understanding the weakness in global trade: What is the new normal?”, ECB Occasional Paper, No 178.
Gaulier, G, W Steingress and S Zignago (2016) “The role of China in the trade slowdown”, Rue de la Banque, Banque de France, No 30 (September).
Hoekman, B (ed) (2015) The global trade slowdown: A new normal? VoxEU E-book, CEPR, London.
IMF (2016) World Economic Outlook, Washington, DC, October.
Jean, S (2016) “Comments on IMF’s ‘Global trade: What’s behind the slowdown?’”, CEPII Blog.
Kindberg-Hanlon and D Young (2016) “The world trade slowdown (redux)”, Bank of England Blog.
Koopman, R, Z Wang and S–J Wei (2014) “Tracing value-added and double counting in gross exports”, American Economic Review, 104(2): 459-94.
Lewis, L and R Monarch (2016) “Causes of the global trade slowdown”, Federal Reserve Board, IFDP Note, Washington: Board of Governors of the Federal Reserve System, November.
OECD (2016) “Cardiac arrest or dizzy spell: Why is world trade so weak and what can policy do about it?”, OECD, Economic Policy Paper, 18.
Powell, J H (2016) “The global trade slowdown and its implications for emerging Asia”, speech delivered at CPBS 2016 Pacific Basin Research Conference.
Slopek, U (2015) “Why has the income elasticity of trade declined?”, mimeo, Deutsche Bundesbank.
Timmer, M P, B Los, R Stehrer and G J de Vries (2016) “An anatomy of the global trade slowdown based on the WIOD 2016 release”, GGDC research memorandum number 162, University of Groningen.
WTO (2016) “Report on G20 trade measures”, Geneva, November.
Endnotes
[1] As country-level imports and exports are increasingly interlinked given the rise in the internationalisation of production, the Bussière et al (2013) model would attribute a large fraction of the decline in a country’s import demand to the decline in its exports when changes in trade are synchronised across countries. In the chapter, we also use an alternative iterative methodology to apportion changes in trade to changes in domestic demand at home and in trading partners.
[2] The model pins down these various factors by matching the implied trade dynamics to those in the data exactly, given observed patterns of trade, production, and prices as well as a set of parameters calibrated using input-output tables.
[3] While complementary, the structural model and the empirical approach differ in important ways. Unlike the empirical analysis, which focuses on explaining the behavior of real trade flows, the structural analysis’ main object of interest is nominal import growth in relation to nominal GDP growth (since the model endogenously computes equilibrium prices and wages).
[4] In order to derive conclusions about world trade, we use trade weights to aggregate country-level import growth predicted by the empirical exercise, which models imports as a function of relative prices and import-adjusted domestic demand at home and in trading partners. In other words, instead of using actual exports to construct import-intensity adjusted demand, our baseline specification uses export demand predicted by each trading partner’s import-intensity adjusted domestic demand. Not surprisingly, a model which uses actual exports in the construction of countries’ import demand can predict an even larger share of the global trade slowdown as in Kindberg-Hanlon and Young (2016) .
[5] Even if the slowdown in real trade growth was perfectly predicted by changes in import demand and relative prices for each country, the ratio of real trade growth to GDP growth at the global level will decline if a larger share of world trade and economic activity shifts to economies with inherently lower income elasticity of trade.
[6] Continued use of import restrictions and other forms of stealth protectionism as reported in the WTO (2016) report may have amplified the role of trade policies in the trade slowdown observed in 2016.
[7] The ECB study similarly examines tariff and non-tariff barriers as well as the evolution of an import restrictiveness index from UNCTAD. Their findings confirm the pattern observed in the disaggregated tariff data—tariffs remained largely unchanged both in advanced and emerging market and developing economies during the trade slowdown.


