After years of steady growth, the global economy has turned and so too has the interest in unemployment (see recent examples on this site Smith 2011 and Cingano and Rosolia 2011). The rising levels of unemployment around the world bring up some key questions:
- How do households allocate their time when someone loses a job?
- Do households allocate their foregone market production to home production?
- How much of the foregone market work hours are allocated to job search?
While answering these questions is important for calculating the welfare costs of recessions and for interpreting the cyclical co-movement of macroeconomic aggregates, up to now such an analysis was not possible given that there was no dataset that had a large enough sample to measure how households allocate their time over the business cycle.
In a recent working paper (Aguiar et al. 2011), we fill this gap. We use newly released data from the American Time Use Survey (ATUS) to document how the allocation of time evolves over the business cycle. The ATUS samples a large cross-section of Americans in every year between 2003 and 2010. According to the Bureau of Labour Statistics, between 2008 and 2010 the US unemployment rate increased from 5.8% to 9.6% and aggregate market-work hours fell by roughly 7%. The ATUS data shows a similar increase of unemployment and a similar decrease of market work hours between 2008 and 2010.
Our analysis starts by segmenting households’ time endowment into several mutually exclusive time categories.
- Market work includes all time spent working in the market sector on main jobs, second jobs, and overtime, including any time spent commuting to or from work and time spent on work related meals and activities. We separate from market work the time spent on job search and the time spent on income-generating activities outside the formal sector. This allows us to study the extent to which households spend time looking for employment or substitute time from the formal to the informal sector.
- Non-market work (home production) consists of four sub-categories: core home production (e.g. meal preparation and cleanup, doing laundry, ironing, dusting, vacuuming, indoor household cleaning, cleaning or repairing vehicles and furniture, etc.), activities related to home ownership (e.g. time spent on household repairs, time spent on exterior cleaning and improvements, time spent on the garden, etc.), obtaining goods and services (e.g. grocery shopping, shopping for other household items, comparison shopping, coupon clipping, going to the bank, going to a barber, going to the post office, obtaining government services, etc.), and care of other adults (e.g. shopping for other adults, helping other adults around the house with cleaning and maintenance, transporting other adults to doctors offices and grocery stores, etc.).
- We analyse separately childcare (all time spent caring for, educating or playing with children) from total non-market work. While there is a well developed market for goods that households are willing to purchase instead of spending time caring for their children (which would make childcare a component of non-market production), childcare may also offer direct utility to parents (which would make childcare a component of leisure).
- Leisure includes activities for which time and expenditure are complements as opposed to substitutes. Examples include time spent watching television, time spent socialising, time spent exercising and on sports, time spent on entertainment and hobbies, and all other similar activities. We also include in our leisure measure activities that provide direct utility but may also be viewed as intermediate inputs such as time spent sleeping, eating, and personal care.
- Finally, we examine how households allocate their time to other investments over the business cycle, such as education, civic and religious activities, and own medical and healthcare.
Given the short time series covered in the survey, looking at the time series patterns may not be very informative for the time-use behaviour of households over the business cycle. This is because the time series patterns combine both low-frequency trends as well as any potential business cycle variation. This is particularly important for the trends in time use for both non-market work and leisure. During the non-recessionary period 2003-2008, home production time was falling and leisure time was increasing. These patterns are extensions of the well-documented trends in aggregate home production time and aggregate leisure time that started in the 1960s (Aguiar and Hurst 2007 and Ramey and Francis 2009). As a result, a naive comparison of the time spent on various activities before and during the recent recession confounds the effect of the recession on time use.
For instance, a comparison of the average time use over 2006-2008 with the average time use over 2009-2010 would lead one to conclude that about 80% of the foregone market hours were reallocated to leisure and essentially none to non-market work.1 Such a comparison is misleading. The correct comparison is what various time-use categories would have been in 2009 and 2010 absent the recession compared to what they actually are during 2009 and 2010. Figure 1 shows the year-to-year estimates for average market work, leisure and non-market work and their linear trends. Specifically, we calculate a linear trend for each time use category based on the 2003-2008 period and then we extrapolate linearly to periods 2009 and 2010. For example, this calculation suggests that in the absence of the recession market work would have increased from 32.31 hours in 2008 to 32.57 hours in 2010. If we used these linear trends as counterfactuals, we would have found that 45% of the 2.09 hours per week decrease of market work between 2006-2008 and 2009-2010 would have been allocated to non-market work and 51% to leisure. This is a dramatically different estimate that the estimate one would obtain without controlling for low-frequency trends in time use.
Figure 1. Trends in market work, leisure and non-market work
The above analysis suggests that the interpretation of changes in time allocation during a recession depends on how we control for low-frequency trends. This is what necessitates our alternate approach of using the variation of business cycles across US states to remove these aggregate trends. Specifically, we use the substantial cross-state variation of changes in market work in the ATUS data to identify how foregone market work hours are reallocated to other time-use categories. As one would expect given the low-frequency trends that we described above, we find that the simple time series analysis overestimates the substitution of foregone market work hours to leisure and underestimates the substitution of foregone market work hours to non-market work.
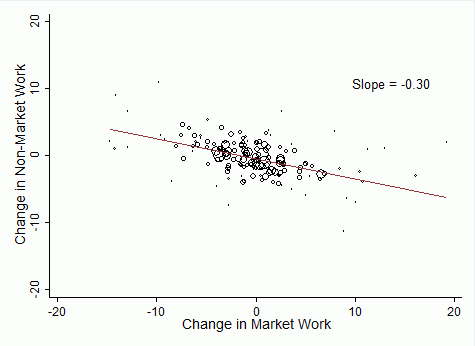
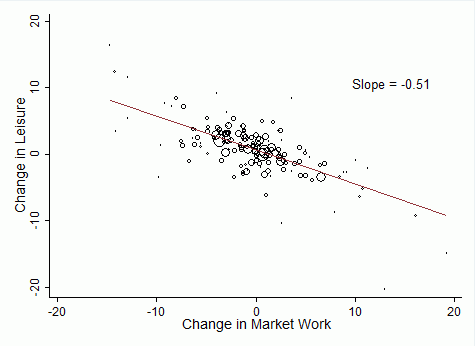
Figures 2 and 3 show the simple scatter plots of the changes in market work hours against the changes in leisure time and the changes in non-market work time using our US states sample. The weighted least squares regression line fitting the data in the scatter plot is also shown. As seen from the two figures, 30% of foregone market work hours are allocated to non-market work and 51% of foregone market work hours are allocated to leisure. Additionally, childcare (which is not included in non-market work) absorbs another 6% of the foregone market work hours. Given that non-market work accounts for only about 11% of the total time endowment, whereas leisure occupies 65% of the total time endowment, our results imply that non-market work is a much more elastic margin of substitution than leisure at business cycle frequencies. We also note that the leisure categories absorbing the largest fraction of foregone market work hours is sleep (roughly 20%) and television watching (roughly 12%). As we discuss in more detail in the working paper, our findings from these simple scatter plots extend to a number of robustness exercises and more formal statistical tests.
Figure 2. Changes in market work vs. changes in leisure across US states (2003-2010)
Figure 3. Changes in market work vs. changes in non-market work across US states (2003-2010)
Moreover, restricting our analysis only to the recent recession sample (2007-2010) implies an even larger substitution towards home production and a smaller substitution towards leisure. Specifically, we find that about 45% of foregone market hours are reallocated to increased non-market work and to increased childcare when we examine only the recent recession sample.
We also find that less than 1% of the foregone market work hours are allocated to job search. However, this represents a fairly large percentage increase given how little time unemployed workers allocate to job search (Krueger and Mueller 2010). We show that individuals increase their time investments in their own health care, their own education, and civic activities. Specifically, around 12% of foregone market hours are allocated to these investments. Given how sizable these reallocations are, our results suggest that it is important to understand whether these are new investments that would not have occurred absent the recession or whether these are investments that would have occurred at some point in the future that are instead moved forward to recessionary times when the opportunity cost of time is low. This distinction is important for understanding the welfare costs of business cycles.
More generally, given the prominence of non-market work as a margin of substitution over the business cycle, it is important to incorporate a home sector both when computing the welfare costs of recessions and when constructing business cycle models. In particular, our results are supportive of workhorse macroeconomic models with home production (Benhabib et al. 1991; Greenwood and Hercowitz 1991). Despite the theoretical importance of these models, the empirical analysis of the business cycle properties of these models was not previously possible because of data limitations.
References
Aguiar, Mark and Erik Hurst (2007), “Measuring Trends in Leisure: The Allocation of Time over Five Decades”, Quarterly Journal of Economics, 122(3):969-1006.
Aguiar, Mark, Erik Hurst, and Loukas Karabarbounis (2011), “Time Use During Recessions”, NBER Working Paper 17259.
Benhabib, Jess, Richard Rogerson, and Randall Wright (1991), “Homework in Macroeconomics: Household Production and Aggregate Fluctuations”, Journal of Political Economy, 99(6):1166-1187.
Cingano, Federico and Alfonso Rosolia (2011), “Where are the jobs? Out there, somewhere. Perhaps.”, VoxEU.org, 17 July.
Greenwood, Jeremy, and Zvi Hercowitz (1991), “The Allocation of Capital and Time over the Business Cycle”, Journal of Political Economy, 99(6):1188-1214.
Krueger, Alan and Andreas Mueller (2010), “Job search and unemployment insurance: New evidence from time use data”, Journal of Public Economics, 94(3-4): 298-307.
Ramey, Valerie and Neville Francis (2009), “A Century of Work and Leisure'', American Economic Journal: Macroeconomics, 1(2):189-224.
Smith, Jennifer (2011), “Unemployment ins and outs: Evidence from the UK”, VoxEU.org, 18 July.
1 For such an analysis using the ATUS data see, for example, the Wall Street Journal article “What Would You Do with an Extra Hour?” published on 23 June 2010.


