In simpler days, exports meant goods made in one nation being sold in another. Boosting exports meant boosting employment and value added in the export sector. Things are more complicated due to the emergence of global supply chains.
As inputs are shipped from country to country through these chains, they get counted multiple times in gross trade data. Further, when these chains span multiple countries, the origin of the value added embodied in final goods is obscured. Additional exports from one nation, say China, can boost value added and jobs in many nations.
These basic issues have long been understood (Hummels et al. 2001) but they have only recently gained prominence in the policy debate. As global supply chains get deeper, wider, and longer, traditional trade data are increasingly unreliable guides to policymaking. Surprisingly little is known – quantitatively speaking – about how the rise of global supply chains has changed the link between trade and jobs, the mechanics of trade balance adjustments, the costs of protectionism and role of trade agreements, and the propagation of shocks across countries.
The need for data describing the structure of global supply chains and their changes over time has stimulated research effort aimed at piercing the veil of the gross flows to measure trade in value-added terms (Johnson and Noguera 2011, 2012a, Escaith and Timmer 2012).1
Our new work assembles time-series trade, input-output, and production data to measure value-added trade for 42 countries over the past four decades (Johnson and Noguera 2012b, 2012c). Looking at changes over long periods yields new stylised facts and evidence on the role of trade costs in shaping global supply chains.
Stylised facts
To focus our analysis, we compare changes in 'value-added exports' – defined as the amount of value added from one country consumed in another – to changes in gross exports.2 We highlight stylised facts about the evolution of value-added versus gross trade for the world as a whole, for individual countries, and among bilateral trade partners.
- For the world, we find that the ratio of value-added to gross exports fell by 10 to 15 percentage points from 1970 to 2009. We identify three distinct eras in the data. The value-added-to-export ratio fell during the 1970s, leveled off or even rose during the 1980s, and then fell rapidly after 1990. The rate of decline post-1990 is roughly three times as fast as pre-1990, implying that two-thirds of the decline is concentrated in the last two decades.
- Across countries, declines in the ratio of value-added to gross exports range from 0 to 25 percentage points since 1970. The largest declines tend to be concentrated in emerging markets with fast growing manufacturing sectors. As the share of manufacturing in exports rises, it lowers the value-added-to-export ratio because manufacturing tends to be intensive in imported intermediate inputs.
- At the bilateral level, both distance and regional trade agreements are significant determinants of changes in value-added-to-export ratios. We focus on these results in the remainder of this note.
The burden of distance on trade
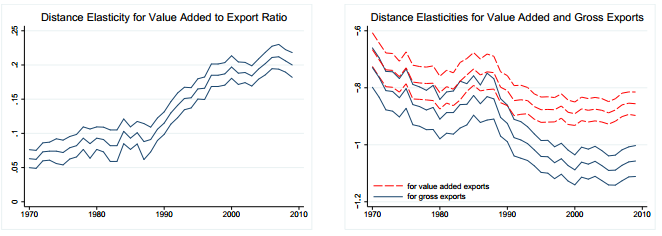
To describe how distance shapes value-added versus gross trade, we estimate the elasticity of value-added exports, gross exports, and the ratio of value-added to gross exports with respect to bilateral distance. And we allow this distance elasticity to change over time, estimating a separate distance coefficient in each year.3 We plot the results in Figure 1.
Figure 1. Distance elasticities
Note: Regressions include time-varying source and destination fixed eects, plus proxies for additional trade costs. In each set of lines, the middle line indicates the point estimate, and upper/lower lines denote 90% condence intervals. Standard errors are clustered by country pair.
In the cross-section, the ratio of value-added to gross exports tends to be higher for trade partners separated by long distances. In this sense, value-added exports tend to 'travel further' than gross exports from source to destination. Looking through time, the correlation of value-added-to-export ratios with distance rises, implying that gross trade is increasingly localized relative to value-added trade.
In the right panel of Figure 1, we plot the distance elasticities for gross and value-added trade separately. The difference between these coefficients is equal to the estimate in the left panel. The takeaway is that the rising correlation of value-added-to-export ratios with distance is primarily explained by a sharp increase in the sensitivity of gross trade to distance.
Regional trade agreements
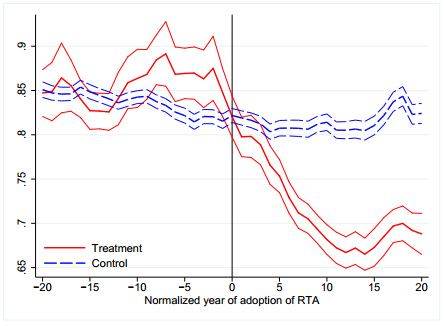
To illustrate the influence of regional trade agreements on gross and value-added trade, we plot value-added-to-export ratios before and after adoption of regional trade agreements in Figure 2. For each pair of countries that adopts a trade agreement, we compute total value-added trade divided by total gross trade between that pair.4 We then form a control series for each pair, using trade partners with which neither country in the pair ever form a trade agreement.5 We average across pairs to form the treatment and control series plotted in the figure, where the x-axis counts years before and after adoption of the trade agreement.
As is evident, value-added-to-export ratios are similar prior to the adoption of a trade agreement among treatment and control groups and then diverge markedly thereafter. Adjustment takes some time, but the gap levels off at around 10-15 percentage points after ten years.
Figure 2. Ratio of value added to gross exports before and after the adoption of regional trade agreements
Note: In each set of lines, the middle line indicates the mean ratio for treatment/control groups, and upper/lower lines denote 90% condence intervals for the mean.
In Johnson and Noguera (2012c), we present these results in panel regressions. Moreover, consistent with the idea that production chains depend on 'deep' policy integration between countries, we find that the deepest agreements (customs unions, common markets, and currency unions) have larger effects than free trade agreements, and that shallow agreements (preferential agreements) have little effect on value-added-to-export ratios.
Concluding remarks
These results suggest that the expansion of global supply chains helps explain why distance continues to be a powerful impediment to gross trade, despite declines in transport costs over time (Disdier and Head 2008). They also demonstrate that trade policy played a prominent role in driving the expansion of global supply chains.
Both results point to the usefulness of measuring trade in value added. We hope that these results stimulate further work in this area. We are focused on combining this new data with structural economic models to quantify the causes and consequences of expanded global supply chains.
References
Disdier, Anne-Celia, and Keith Head (2008). "The Puzzling Persistence of the Distance Effect on Bilateral Trade." The Review of Economics and Statistics, 90(1): 37-48.
Escaith, Hubert and Marcel Timmer (2012). "Global value chains, trade, jobs, and environment: The new WIOD database", VoxEU.org, 13 May.
Hummels, David, Jun Ishii, and Kei-Mu Yi (2001), "The Nature and Growth of Vertical Specialization in World Trade." Journal of International Economics, 54(1): 75-96.
Johnson, Robert C, and Guillermo Noguera (2011), "The value-added content of trade", VoxEU.org, 7 July.
Johnson, Robert C. and Guillermo Noguera (2012a), "Accounting for Intermediates: Production Sharing and Trade in Value Added." Journal of International Economics, 86 (2): 224-236.
Johnson, Robert C. and Guillermo Noguera (2012b), "Proximity and Production Fragmentation." The American Economic Review (Papers & Proceedings), 102 (3): 407-411.
Johnson, Robert C. and Guillermo Noguera (2012c), "Fragmentation and Trade in Value Added over Four Decades." NBER Working Paper No. 18186.
1 The OECD and WTO have also recently launched a joint effort to develop official measures of trade in value added. See http://www.oecd.org/trade/valueadded.
2 To be more precise, 'value-added exports' are the amount of value added produced by a given source country that is embodied in final goods absorbed in a particular destination (Johnson and Noguera 2012a).
3 We use a reduced-form 'gravity-style' regression specification: we regress the log of the dependent variable in each year on exporter-year and importer-year fixed effects, along with the log of bilateral distance with a year-specific coefficient. We run this estimation in panel form, clustering standard errors at the pair level. In the paper, we include other proxies for trade costs as additional controls.
4 We use data on trade agreements compiled by Scott Baier and Jeffrey Bergstrand, which is available at: http://www.nd.edu/~jbergstr/. We define an RTA to be a 'free trade agreement' or stronger.
5 For countries (i,j) that form an RTA, countries (k) with which neither i nor j ever form an RTA are included in the control group. We use a weighted average of bilateral value-added to export ratios for i with k and j with k to form the control series. See Johnson and Noguera (2012c) for details.


