The line of argument in Thomas Piketty’s much discussed book, Capital in the Twenty-First Century, revolves around the inequality formula “r > g” that he postulates (Piketty 2014). According to this, the rate of return on capital “r” exceeds overall economic growth “g”. This formula apparently leads to an increasing shift away from income earned from work towards capital income through the interplay between what he calls the “fundamental laws of capitalism”. As the share of earnings from work as a proportion of national income falls, that of capital income grows. Inequality, so his theory goes, grows even more with this shift in forces. The distributive effect in favour of capital owners becomes even greater in the sense that the latter can be assumed to have a higher savings rate than those earning their income from work.
However, is this inequality formula really that excitingly new and accurate? Furthermore, if it is right, what conclusions should we draw from it? Are we not overlooking the fact that different rates of return can be expected from different kinds of investment? Those who take a more risk-oriented approach to investing should be able to expect that these investments will generate a higher risk premium over time. Capital market theory tells us that we can expect to earn a premium on risk capital for the risk we take. The question arises as to how willing people are to invest in riskier asset classes, such as equities. Since Piketty subsumes the average real interest rate of an economy in “r”, however, the different risk premiums are not taken into account.
Ibbotson and Chen (2003), among others, but also Fama and French (2002), calculated a risk premium on the basis of historical data that equity investors achieved in comparison to government bonds.
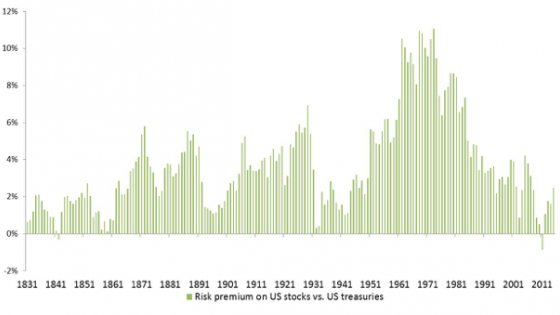
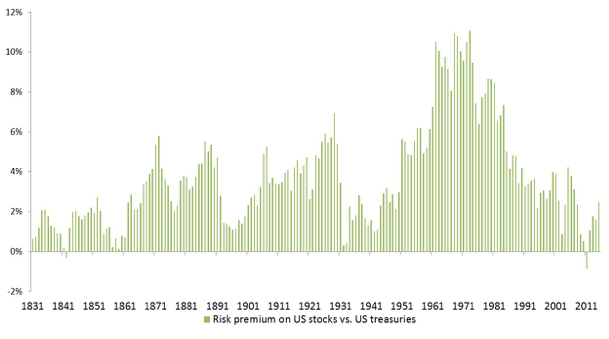
Consequently, the actual “fundamental law of capitalism” would have to be formulated in this way: those who invest in opportunity-oriented forms of investment can expect a premium in the long run as a reward for this risk – or they would not take the risk in the first place. It is clear from looking at long-term historical data series, which are available for the US equity market,1 that the expectation of a risk premium was not disappointed. When the risk premium of US stocks is compared to US Treasuries with a 30-year duration over periods of 30 years from the beginning of the available time series (1801) until the end of 2015, what becomes apparent is that an average risk premium of 3.7 percentage points is achieved in the 30-year periods. The worst-performing 30-year period was from 1981-2011, with an average risk premium of -0.85 percentage points; the best period was 1943-1973 with an 11-percentage point risk premium.
If the investor does not define security as the absence of price volatility but as the conservation of purchasing power, i.e. by factoring in the effect of inflation, historically equities were even ‘safer’ than bonds over a long investment horizon of ten years or more. In an analysis of 10-year rolling average yields over the last 215 years, the negative outliers for equities in comparison to short or long-term government bonds were even lower. At the peak of the 10-year period from 1949 to 1959, a shareholder could earn an average of about 17% p.a. in real terms, while from 1911 to 1921 in the course of World War I and from 1965 to 1975 during the first oil crisis he would have lost around 4% p.a. when buying equities. US bondholders, on the other hand, suffered the largest real loss of over -5% p.a. in the investment period of 1971 to 1981 – a phase of strongly elevated inflation. In comparison to this, the negative performance of equity markets from 2000 to 2009, in which the dotcom bubble burst and the financial crisis occurred, was a modest -3% p.a.
Figure 1 Risk premium on US stocks vs. US treasuries (rolling 30-year yields)
Note: Past performance is not an indication of future results.
Source: Jeremy Siegel database 1801 – 1900 & Elroy Dimson, Paul Marsh, and Mike Staunton 1900 – 2009, Datastream, Allianz Global Investors Capital Markets & Thematic Research; 31/12/2015.
When extending the investment horizon yet further, rolling 30-year time periods over the previous 215 years show that equities always achieved positive real rates of return. On average, capital growth adjusted for inflation was 6.94% p.a. The lowest 30-year return was 2.81% p.a. in the period of 1903 to 1933, the highest 10.6% p.a. from 1857 to 1887. However, even the most recent 30-year equity market period stands up well to a historical comparison, despite numerous upheavals on the capital markets. If a shareholder had bought US equities in 1985, he would have been able to achieve a real growth in capital of just about 7.9% p.a.
In the case of time periods of 10 and 30 years, however, there was a definite risk of a real capital loss with US government bonds. Investors in Treasuries, for example, experienced negative real yields during the period of 1934 to 1964 and the following periods until 1985 - the era of ‘financial repression’. At its peak, the loss in real terms over a period of 30 years on 10-year government securities was -2.00% p.a. (1950 to 1980).
What is clear from a review of 10 and 30-year periods is that only equities, in contrast to bonds, managed to achieve a real positive rate of return in all 30-year periods. While an investor earned a -2% return p.a. with bonds in their worst 30-year period, around +3% p.a. was the lowest real capital growth that equities achieved. The best 30-year investment period generated 7.44% with bonds and about 11% with equities.
The result: taking higher risks was clearly rewarded in the case of equities. Taking purchasing power into account, equities provided a higher degree of security than bonds.
The risk premium is the greatest force for inequality! If you want less inequality, you have to embrace the risk premium and therefore equities.
References
Fama, F. and K. French (2002), “The Equity Premium”, The Journal of Finance 57(1).
Ibbotson, R.G. and P. Chen (2003), “Long-Run Stock Returns: Participating in the Real Economy”, Financial Analyst Journal 59(1).
Naumer, H.-J. and D. Nacken (2016), “Equities – the new safe option for portfolios?”, Allianz Global Investors, Frankfurt
Piketty, T. (2014), Capital in the Twenty-First Century, Cambridge, MA: MIT Press.
Endnotes
[1] The Jeremy Siegel Database was used as the basis of calculations for the period of 1801-1900, Elroy Dimson, Paul Marsh and Mike Staunton for the period of 1900-2009 and Datastream for subsequent years.


