Monitoring national trade policies took on increased importance at the peak of uncertainty of the Great Recession in 2008-2009. However, despite initiatives from the WTO, World Bank, and Global Trade Alert (GTA), even the most interested trade policy observer could be understandably confused by recent reports on protectionist trends. For example, in February 2012 the WTO (2012a) reported optimistically that "concerning anti-dumping, the most frequently used trade remedy instrument, there has been a significant decline in initiations of new investigations... As for safeguards, although initiations surged between 2008 and 2009, they have been declining since then." Yet three short months later, in the run-up to the most recent G20 meeting in Mexico, the WTO (2012b) subsequently reported direly "[t]he past seven months have not witnessed any slowdown in the imposition of new trade restricting measures by G20 economies."1
This column clarifies one aspect of the protectionism issue by reporting results based on careful measurement and inter-temporal analysis of product-level information from the World Bank’s Temporary Trade Barriers Database.2 The database has been recently updated to reflect data on policy changes taking place through 2011 through the temporary trade barriers (TTBs) arising from antidumping, safeguards, and countervailing duties. The column draws from new research in Bown (2012a) which covers policy use by 24 high-income and emerging economies that collectively accounted for more than 80% of global GDP and more than 86% of world merchandise imports in 2011.3 Temporary trade barriers are worth examining in detail as they have turned into the major class of potentially WTO-legal policies that the main economies in the WTO system have used to implement new import protection over the last 20 years, including during the Great Recession.
G20 countries: Emerging economies are behind the recent increase in import protection
In previous research (Bown 2011a), I reported data from a sample of the major G20 users of TTB policies for the period 1990-2009.4 That analysis introduced relatively simple and informative accounting measures to distinguish between the import products subject to the 'flow' of new protection versus the accumulating “stock” of protection under current and previously-imposed TTBs.5 One striking result was that, at the height of the crisis, emerging economies sharply increased their share of import products subject to TTBs – i.e., an increase of 40% between 2007 and 2009. In sharp contrast, the hard-hit high-income G20 economies increased their protection coverage by less than 10%.
Figure 1a updates the analysis with newly available data on all TTB policy changes through the end of 2011. The G20 emerging economies of Argentina, Brazil, China, India, Indonesia, South Africa, and Turkey have increased the collective share of import products that they subject to such import protection by 67% in 2011 as compared to 2007 – i.e., the collective share of G20 emerging economy import products subject to TTBs in 2011 reached 3.2%, up from only 1.9% of import products in 2007 and 2.9% in 2009.6 This increase occurred despite a reduction in 2010 and 2011 in the “flow” of import products subject to new TTB investigations; i.e., new import protection has decreased from a local peak of 0.6% of import products in 2008 to only 0.2% in 2011. The stock of import products subject to protection has continued to increase because the imposition and scope of new protection outpaces removal of previously-imposed protection; i.e., supposedly temporary protection that is frequently being extended or renewed.
Figure 1. G20 imports affected by Temporary Trade Barriers, 1997-2011
(a) By count of import products
(b) By value of imports (trade-weighted)
Source: Bown (2012a, Appendix Figure 1). Share of nonoil imports, constructed by the author from Bown (2012b) and HS-06 import data from UN Comtrade via WITS.
Notes: TTB=temporary trade barrier which includes all use of antidumping, safeguards, and countervailing duties. G20 High Income economies include Australia, Canada, European Union, Japan, South Korea, and the United States. G20 Emerging economies include Argentina, Brazil, China, India, Indonesia, South Africa and Turkey. Mexico omitted for reasons described in the text.
Figure 1b presents a slightly more refined measure of the economic significance of TTB protection by trade-weighting the policy information with product-level data on bilateral imports. After trade-weighting, Figure 1b indicates the same upward trend for the G20 emerging economies; albeit there is a more modest 16% increase between 2007 and 2011 in the share of imports subject to TTBs, from a 2.8% level in 2007 to 3.3% of imports in 2011. The explanation for the difference in the two panels (a larger increase in share of import products in Figure 1a, a smaller increase in the trade-weighted share of the value of imports in Figure 1b) is due to the net effect of the underlying policy churning. While a significantly larger share of import products became subject to new TTBs than were removed between 2007 and 2011, the TTB removals during this period had significant coverage of trade (as a share of the value of total imports) that, on net, helped to dampen the impact of newly imposed protection.
High-income economies: Overall, TTB import protection coverage is flat-to-declining
Consider the high-income G20 member economies of Australia, Canada, European Union, Japan, South Korea and the US. Collectively these economies’ TTBs are represented by the dashed lines in Figure 1a and 1b. Despite much weaker economic growth during 2008-11, Figure 1a illustrates that high-income economies collectively increased the share of import products subject to import protection by only 13% from 2007 to 2011, from a 1.7% level to 1.9% of import products.
Furthermore, on a trade-weighted basis (Figure 1b), the measured coverage of imports impacted by G20 high-income economies’ TTBs has actually declined by 23% between 2007 and 2011, from 2.8% of imports to 2.2%. Again, the qualitative difference in the results for high-income economies (a small increase in Figure 1a, a small decrease in Figure 1b) is due to the net impact of the trade coverage of the protection being applied and removed during the period.
Country-by-country measures of imports covered by protection
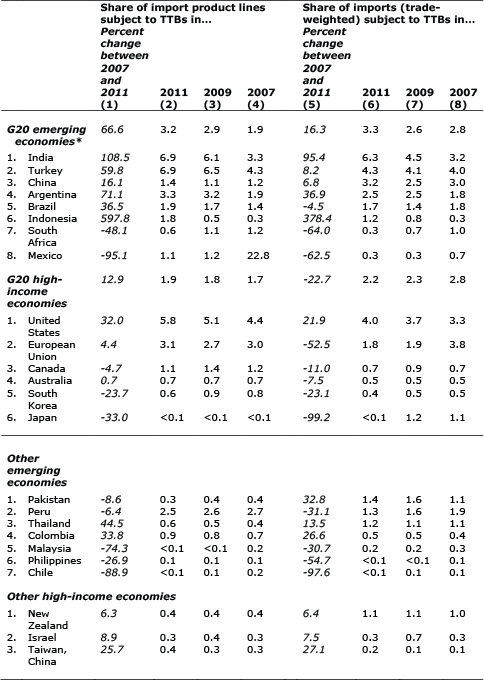
While understanding overall trends is important, there is much more useful information in the economy-by-economy assessments of these measures of import protection. Table 1 summarises information for 24 of the individual, policy-imposing economies in the Temporary Trade Barriers Database (Bown 2012b). The table presents information for the two measures defined above: the first based on TTB coverage of import product lines, the second trade-weights protection by import values.
To interpret Table 1, consider India. Between 2007 and 2011, India increased by 109% the share of imported 6-digit HS products over which it had imposed a TTB – from 3.3% in 2007 to 6.9% in 2011. On a trade-weighted basis, India increased import protection coverage by 95%, from a 3.2% level in 2007 to 6.3% of imports in 2011.
Table 1. For which economies bas TTB import protection increased alongside the Great Recession?
Source: Bown (2012a, Appendix Table 1). Ranked by column (6) within each category of policy-imposing economy. Share of nonoil imports, constructed by the author from Bown (2012b) and HS-06 import data from UN Comtrade via WITS.
Notes: TTB = temporary trade barrier which includes all use of antidumping, safeguards, and countervailing duties. *Mexico omitted from G20 emerging economy aggregation for reasons described in the text.
The Great Recession period has resulted in a differential impact on import protection coverage across countries. Of the 24 economies in Table 1, according to the product measure, 14 economies had import coverage increase between 2007 and 2011, and 10 had it decrease. According to the trade-weighted measure, 12 economies had protection coverage increase and 12 economies had it decrease.
The strongest evidence of an increase in TTB import protection between 2007 and 2011 arises from a number of major emerging economies in the G20. Six of the eight G20 emerging economies in Table 1 had the share of import products subject to protection increase between 2007 and 2011, and five also increased the trade-weighted share of imports subject to protection. India, Turkey, China, Argentina, and Indonesia had protection rise according to both measures, while Brazil’s protection increased on a product basis but declined slightly on a trade-weighted basis. Two economies – South Africa and Mexico – had import protection decline substantially according to both measures.
Among the G20 high-income economies reported in Table 1, only the US had import protection increase according to both measures between 2007 and 2011 – by 32% on a product basis and 22% on a trade-weighted basis. Three economies – Canada, South Korea and Japan – had import protection decline according to both measures. Protection for Australia and the EU increased slightly on a product basis but declined on a trade-weighted basis.
The lower half of Table 1 reports these measures of TTB import protection for ten smaller, non-G20 economies for the first time. According to the product measure, five countries had protection increase, and five had a decrease. According to the trade-weighted measure, there were six increases and four decreases. Thus the overall change in import protection between 2007 and 2011 for these economies was relatively flat as each had a relatively small share of imports (under both measures) subject to TTBs during this period.
Conclusion
For a number of major emerging markets, import protection through antidumping, safeguards, and countervailing duty policies – collectively referred to as temporary trade barriers (TTBs) – has increased considerably since the start of the Great Recession. This is a worrisome trend. Somewhat surprising is that equivalent increases in this form of import protection have not taken place across the board.
Finally, while these forms of import protection may be the most frequently changing and the most easy-to-monitor, they are not the only trade policies requiring surveillance and study. Additional product-level analysis is especially needed to investigate the complementarities and substitutability of TTB policies alongside applied and bound tariffs, subsidies, and other non-tariff measures (Bacchetta and Beverelli 2012).
References
Bacchetta, Marc and Cosimo Beverelli (2012), “Non-tariff measures and the WTO”, VoxEU.org, 31 July.
Bown, Chad P (2012a), “Emerging Economies and the Emergence of South-South Protectionism”, World Bank Policy Research working paper No. 6162, August.
Bown, Chad P (2012b), Temporary Trade Barriers Database, The World Bank, available at http://econ.worldbank.org/ttbd/, May.
Bown, Chad P (2011a), "Taking Stock of Antidumping, Safeguards and Countervailing Duties, 1990-2009", The World Economy, 34(12):1955-1998.
Bown, Chad P (ed.) (2011b), The Great Recession and Import Protection: The Role of Temporary Trade Barriers, CEPR and World Bank.
Evenett, Simon (2012), Débâcle: The 11th GTA report on protectionism, CEPR, Vox, GTA.net.
WTO (2012a), “Lamy notes “significant decline” in anti-dumping investigations”, 27 February, Geneva.
WTO (2012b), “Report on G20 trade measures”, 31 May, Geneva.
1 This latter sentiment was echoed by Evenett (2012) which labeled such trends a “debacle.” Furthermore, the latest GTA report calls into question the trends highlighted in WTO (2012a) by indicating “that the amount of protectionism in 2010 and 2011 was considerably higher than previously thought.”
2 The Temporary Trade Barriers Database (Bown, 2012b) has been made freely available to the public via the Internet since 2005, and it contains product-level data on imports affected by antidumping, safeguard, and countervailing duty policies. The database tracks each economy's policies back to at least 1995; for many economies, the data coverage extends back to the 1980s.
3 The only major economy that is a substantial user of TTBs that has not been included in the analysis is Russia, which had not yet acceded to the WTO and thus become subject to multilateral disciplines (and reporting requirements) on TTB use during this period.
4 More detailed case studies on the G20 economies with analysis of policies taken through 2009 are available from Bown (2011b).
5 Coverage of affected imports can change considerably even in the absence of significant surges of newly imposed TTBs, through the pace and scope by which temporary barriers are (or are not) removed. As one extreme example, Mexico removed TTBs covering more than 20% of its import products in 2008 when it terminated antidumping duties on imports from China that had been in effect since 1993.
6 The analysis is undertaken at the 6-digit Harmonized System product level, the most disaggregated level that is comparable across countries, and considers nonoil imports only. See Bown (2012a) for a discussion. Bown (2011a) provides a more complete description of a number of technical measurement issues that arise in the construction, interpretation, and use of these two different assessments of TTB import protection coverage.


