Why do firm-level stock returns co-move more than firm fundamentals would suggest? A number of researchers have identified the excess co-movement ‘puzzle’, (e.g. Veldkamp 2006, Pindyck and Rotemberg 1993, Morck et al. 2000) which has important implications for investment incentives on the part of firms, portfolio choice decisions on the part of investors, and ultimately, the efficiency of the allocation of capital. In a recent paper, we link excess co-movement to common beliefs on the part of investors (David and Simonovska 2016). We show that across a number of countries, the correlation of investor beliefs about firm performance is strongly related to the correlation of firm-level returns and that both exceed the level justified by firm fundamentals. We then develop a simple model of equity market trading under imperfect information that allows us to quantify the implications of correlated information. The model leads to return correlations on par with those in the data. Further, we find that correlated beliefs explain a substantial portion of differences in aggregate stock market volatility across countries and that the commonality of beliefs is the key factor, rather than their overall precision.
Measuring common beliefs
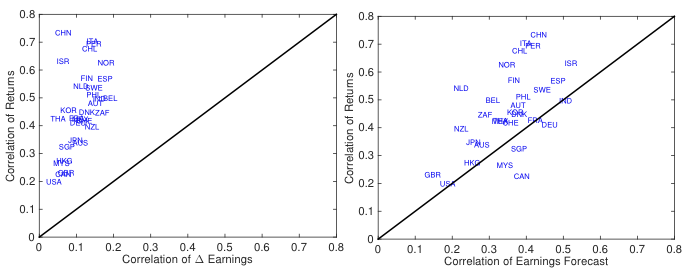
In line with our work, previous research has pointed to correlated information as a potential force behind return co-movement (e.g. Veldkamp 2006). Quantifying this channel has been challenging, however, since one does not typically observe agents’ information sets. To overcome this hurdle, we turn to direct data on market participants’ expectations of firm fundamentals – namely, firm-level earnings forecasts made by security analysts collected by the I/B/E/S database. We illustrate our main empirical findings in Figure 1. The left-hand panel of the figure plots the correlation of returns against the correlation of earnings (our measure of fundamentals) across 31 countries for which adequate data are available. Return correlations generally exceed earnings correlations and the relationship between the two is weak at best. This is the excess co-movement puzzle. In contrast, the right-hand panel of the figure plots return correlations against the correlation of earnings forecasts (our measure of beliefs) – the two are more closely aligned and the levels are on par.1
Figure 1. Firm-level correlations: Returns, fundamentals and forecasts
Source: Compustat Global and I/B/E/S
A quantitative exercise
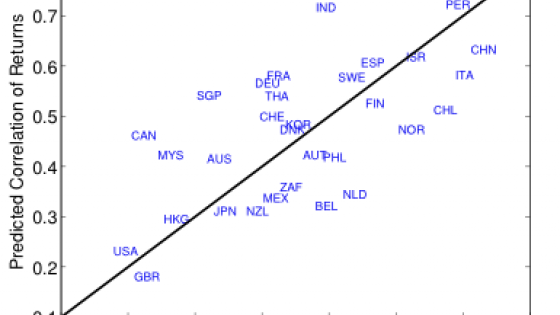
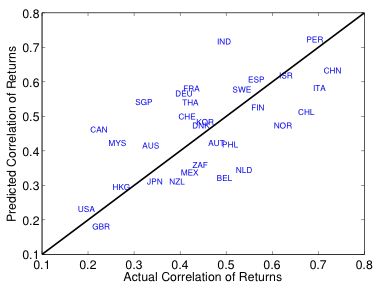
Motivated by these findings, we outline a parsimonious model of equity market trading under imperfect information to quantify the effects of common beliefs on return co-movement. Financial market traders perfectly observe the lagged fundamentals of each firm and a noisy signal of contemporaneous fundamentals. Fundamentals and the noise in investors’ signals are both potentially correlated across firms. The model provides a simple mapping from the correlation in beliefs to that in returns, even after controlling for the common component of fundamentals. Using the correlation of beliefs and fundamentals across firms as inputs for each country, Figure 2 plots the main output of our quantitative model – the model-implied return correlations against the actual. The calibrated model leads to return correlations very much in line with the data, both in levels and in the cross section of markets (for example, the average return correlation implied by the model is 0.47 vs 0.46 in the data; the correlation between predicted and actual is 0.63).
Figure 2. Firm-level return correlations: Predicted versus actual
Source: Compustat Global and model predictions
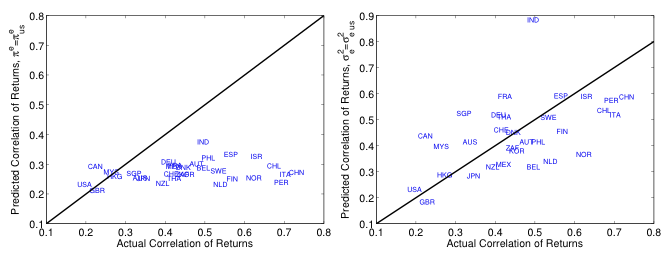
To highlight the role of common beliefs, we use our model to perform two experiments. First, we set the correlation in investors’ signals in all countries equal to that in the US, and we compute the predicted correlation of returns under this counterfactual scenario. The left-hand panel of Figure 3 shows that return correlations generally fall substantially across markets and that little cross-sectional variation remains. Second, we set the overall signal precision in all countries equal to that in the US. The right-hand panel of Figure 3 shows that the effect on return correlations is comparatively small, and in some cases, this correlation can actually rise. These results suggest that it is the commonality of beliefs, rather than their overall precision, that plays the crucial role in leading to return co-movement.
Figure 3. Actual and counterfactual predicted firm-level return correlations
Source: Compustat Global and model predictions
We further examine one natural application of our results – the implications for aggregate stock market volatility. The data show a strong empirical relationship between return co-movement and market volatility – a regression of the latter on the former across countries yields an R-squared of 0.64. Running the analogous regression using the return correlations implied by our model as the right-hand variable yields an R-squared of 0.44. Thus, our results suggest that the measured levels of commonality in investor beliefs can explain about 44% of the cross-section of market volatility (and about 70% of the volatility-correlation relationship; 0.44 divided by 0.64).
We conclude our analysis with a consideration of why belief correlations may differ across countries – specifically, the determinants of the costs of information production and/or the benefits. To do so, we associate our empirical measure of belief correlation with a number of measures of institutional quality across countries, such as indices of political stability, regulatory quality, and investor protection, each of which has a statistically significant relationship with belief correlation. Although purely qualitative, our findings suggest that institutional quality plays an important role in incentivising the production and acquisition of firm-specific information and so in reducing belief correlation and stock market volatility.
Conclusions
Using direct data on the expectations of market participants, we have found that commonality in beliefs can explain the excess co-movement of firm-level stock returns and the fact that excess co-movement is more severe in emerging markets. By leading to greater market-wide volatility, for example, our findings have implications for firms’ investment incentives and the allocation of capital, both key determinants of economic development. An important next step would be to gain a further understanding of the precise source of correlated information – or building on some of our suggestive results regarding the role of institutional quality to investigate more rigorously the factors leading to a lack of firm-specific information. Uncovering these forces may help provide guidance as to whether there are actions that could be undertaken to potentially reduce excess co-movement and volatility and so perhaps improve economic outcomes through this channel.
References
David, J M and I Simonovska (2016) “Correlated beliefs, returns, and stock market volatility”, Journal of International Economics, 99: S58-S77.
Morck, R, B Yeung and W Yu (2000) “The information content of stock markets: Why do emerging markets have synchronous stock price movements?” Journal of Financial Economics, 58(1): 215–260.
Pindyck, R S and J J Rotemberg (1993) “The comovement of stock prices”, Quarterly Journal of Economics, 1073–1104.
Veldkamp, L L (2006) “Information markets and the comovement of asset prices”, Review of Economic Studies, 73(3): 823–845.
Endnotes
[1] Similar findings obtain after controlling for common empirical risk factors to capture aggregate shocks to discount rates and under different timing conventions, i.e. varying the frequency of the data between annual and quarterly and varying the forecast horizon between approximately one year and one month prior to the end of the fiscal year for which the forecast is made (these windows correspond to forecasts made upon release of the previous fiscal year’s earnings followed by the first, second and third quarters of the current fiscal year).
