This is a very special year for economic geography. According to the United Nations Population Division, “In 2008, the world reaches an invisible but momentous milestone: For the first time in history, more than half its human population, 3.3 billion people, will be living in urban areas.” The 2008 Nobel Prize in Economics has been awarded to Paul Krugman “for his analysis of trade patterns and location of economic activity.” Hence, the magnitude of spatial inequalities within and between countries as well as the role and strength of agglomeration economies in driving economic development are acknowledged both among policymakers and in the academic world.
New Economic Geography stresses the existence of a non-monotone relationship between the spatial pattern of economic activity and the degree of economic integration. Specifically, in a world characterised by various types of scale economies, falling mobility costs foster the geographical concentration of activities, the reason being that firms are able to better exploit increasing returns by setting up in large markets. Nevertheless, below a certain threshold of mobility costs, differences in market access become secondary in comparison with other costs brought about by spatial concentration. For example, non-traded goods, especially housing, have higher prices in large cities, while firms compete for the same workers, which pushes up wages and yields producers to fragment their activities across spatially separated units. Hence, a deeper economic integration would give rise to a bell-shaped curve of spatial development – spatial inequality would first rise and then fall.1 It should be stressed, however, that very few trustworthy historical data at a fine spatial level are available to test the relevance of this relationship over the long run.
In the case of France, we are privy to three different variables (value-added, employment and population) for three basic sectors (agriculture, manufacturing, and services) at different points in time (1860, 1896, 1930, 1982 and 2000)2 and at a fine geographical level (88 continental “départements” in 1860). France experienced a ten-fold increase of its real income per capita during 1860-2000 in spite of a growing population. During the 1860-1930 period, the average annual growth rate is 0.94%, which implies that the standard of living doubles every 70 years. Rising to an annual average of 2.4% during 1930-2000, the new growth rate ensures a doubling of the standard of living in less than 30 years. Value-added per worker falls just short of doubling between 1860 and 1930, whereas it increases more than 6-fold during the second sub-period, 1930-2000.
The evolution of spatial inequality within and between French regions
In our discussion paper,3 we use the Theil index to measure the difference between the actual distribution of economic activity and the benchmark uniform distribution. This index bears the advantage of allowing the interdepartmental inequality to be decomposed into a measure of concentration within and between the 21 contemporary French continental regions.
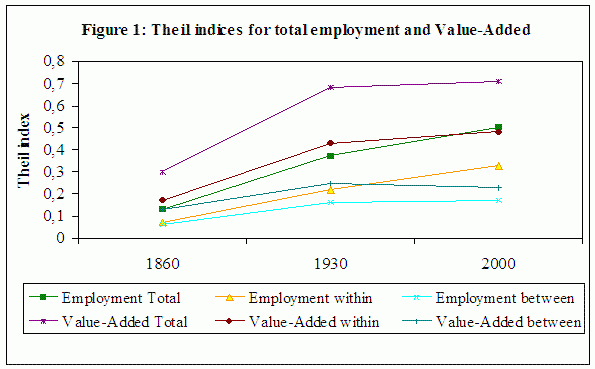
Figure 1 reveals the strong increase in spatial concentration the French labour force experienced over the course of the past century and a half – the Theil index in 2000 is thrice higher than in 1860. In addition, although the value-added consistently exhibited more spatial inequality, it became concentrated less rapidly than employment.
When considering the time period as a whole, the inequality across departments is primarily due to a higher concentration of activity within regions. During the 1860-1930 sub-period, the within- and between-region variations of both employment and value-added increase more or less at the same speed. The rise in spatial inequality is slightly stronger within than between regions. Over the course of the 1930-2000 sub-period, the between-region inequality remains remarkably stable; the observed increase in concentration is chiefly driven by within-region variations across the two variables. This suggests that a few French departments (regional capitals are the most likely candidates) have progressively become more attractive at the expense of the other departments belonging to the same region. While a cursory glance might lead one to conclude that the French national territory mirrors a core-periphery structure - “Paris and the French desert” - our analysis lends credence to the emergence of multi-polarisation through the rise of second-tier urban regions.
Regarding the manufacturing sector, while a considerable increase in spatial concentration characterises the first sub-period, this trend is reversed and fully undone during the second sub-period. In fact, the degree of dispersion in 2000 exceeds the 1860 level (Figure 2).
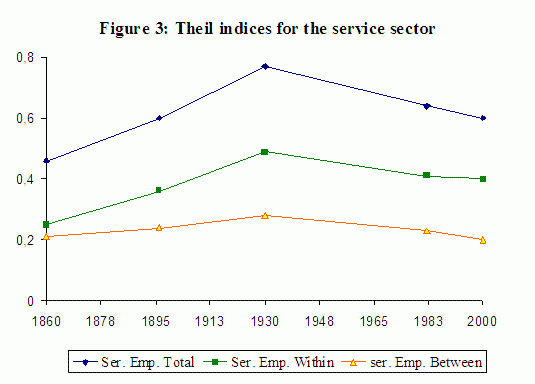
Thus, the spatial concentration of the manufacturing sector follows a bell-shaped curve, as predicted by economic geography when transport costs sharply decrease. The same overall trends are observed in the service sector (Figure 3). However, the dispersion of services during the second sub-period is less pronounced, which may be explained by the fact this sector is less land-intensive than manufacturing.
In contrast, per capita value-added has spread among French regions as well as among the departments that make up each region. The average productivity of labour exhibits even greater dispersion over time – the Theil index experienced a five-fold decline over the course of 140 years. As a result, alongside an increase in the spatial concentration of the population and production is a decrease in both the value-added per capita and the labour productivity inequality across departments. It is worth noting that, unlike value-added and employment, this convergence occurs primarily among the departments belonging to the same region. These evolutions can be first explained by the substantial increase in the number of public jobs. Second, because workers tend to migrate towards areas with high wages, the growth of productivity there is curbed by the large inflow of migrants. Conversely, the law of diminishing returns makes more productive the agricultural areas from which workers have drifted from the land.
The sources of agglomeration economies
Spatial inequality is typically explained by agglomeration economies. Observe first that the overall size of the local market and the intensity of local interactions foster a finer division of labour as well as innovation and growth; it is typically captured by the local employment density. Furthermore, the concentration of firms belonging to the same industry may be conducive to the rapid imitation and diffusion of product innovations and new production processes as well as to the sharing of specific inputs – thereby creating potential gains linked to specialisation. Note, finally, that there are also potential benefits of being located in an area accommodating various industries. Under this view, radical innovations developed in one industry may be borrowed and implemented in others, while firms operating in different sectors may share high-level business-to-business services. Sectoral diversity may then result in significant productivity gains. Yet, increasing the spatial concentration of firms intensifies competition for labour, land and products, which pushes towards the dispersion of firms. In addition, specialisation does not allow workers to be resilient to negative shocks specific to the local industry, while diversity may contribute to more congestion in facilities and infrastructure. Therefore, the overall impact of spatial concentration can be positive or negative.
Our analysis confirms the existence of density economies, implying that the benefits of agglomeration exceed its costs: the density-elasticity of labour productivity is, respectively, equal to 0.13 and 0.07 in manufacturing and services. In other words, doubling density increases productivity by 9.4% in manufacturing and 5% in services. Specialisation has a positive effect on services but is not significant for manufacturing. Finally, gains stemming from diversity are positive for both sectors.
Two further factors also account for the shaping of the French spatial -economy. Bearing in mind the role of transport costs in economic geography, one expects that firms’ proximity to large outlets help increase their profitability. And indeed, we find that the access to other departments markets positively affects firms’ productivity during 1860-1930, a time period characterised by relatively high transport costs in France – its marginal impact is even stronger than that of employment density. Furthermore, it is now well documented that education plays a growing role in structuring the spatial distribution of economic activity. During the 1860-1930 sub-period, human capital did not play any role in the emergence of inter-departmental disparities. This finding is probably the result of France’s very diffuse and fairly homogeneous elementary schooling over that time period. In contrast, in 2000 the spatial distribution of skills is a critical determinant of agglomeration economies. Market potential loses its significance, probably because transport costs vastly decreased during the last decades. In other words, nowadays human capital supersedes market potential in accounting for spatial disparities in labour productivity. The reason is that skilled workers and skill-intensive firms tend to cluster in order to benefit from a better match between jobs and workers as well as from technological and informational spillovers. Investigating deeper these various issues from both the theoretical and empirical viewpoints should rank high on the research agenda.
1 See Combes, Mayer and Thisse, Economic Geography: The Integration of Regions and Nations (Princeton University Press 2008) for further details.
2 Note that data for 1896 are incomplete in that we have the wage bill, but not the value-added, for the manufacturing sector.
3 ‘The rise and fall of spatial inequalities in France: A long-run perspective.’ CEPR Discussion Paper 7017.


