Unlike most other goods, electricity cannot be cost-effectively stored even for short periods. Supply must always meet demand, or you have blackouts. In addition, electricity demand is highly variable and inelastic (Ito 2014). As a result, electricity markets clear mostly on the supply side, with production ramping up and down to meet demand (Borenstein 2000, Griffin and Puller 2005). Consequently, electricity prices vary dramatically, often by a factor of ten or more in a single day.
These features of electricity markets are well known, yet most analyses of energy efficiency policies ignore this variation. For example, when the US Department of Energy considers new energy efficiency standards, it focuses on total energy savings, without regard to when they occur. With a few notable exceptions, both policymakers and academics have given little attention to how the value of energy efficiency depends on when savings occur.
In new paper, we demonstrate the importance of accounting for timing (Boomhower and Davis 2017). Our study uses hourly smart meter data from more than 5,000 participants generated by a rebate programme for energy-efficient air conditioners in southern California. We measure the change in electricity consumption after installation, and show that savings tend to occur during July and August, and between 3pm and 9pm.
When does this investment save electricity?
Figure 1 shows large differences in electricity savings across seasons and hours. During July and August there are large energy savings, particularly between 3pm and 9pm. During non-summer months, savings are much smaller — less than 0.05 kilowatt hours saved on average per hour.
Figure 1 Electricity savings by hour of day
Notes: Figure plots estimated coefficients and 95th percentile confidence intervals from 48 least-squares regressions. For each regression, the dependent variable is average electricity consumption during the hour of the day, indicated on the horizontal axis. All regressions are estimated with household-by-week observations and control for week of sample, by climate zone, and household by month-of-year fixed effects. The sample for all regressions includes all households who installed a new air conditioner between 2012 and 2015, and all summer- or non-summer months, as indicated. Standard errors are clustered by nine-digit zip code.
We compare our estimated time profile with ex ante engineering estimates. The two sets of estimates are similar, with several interesting differences. Most importantly, the econometric estimates indicate peak savings between 6pm and 7pm, compared to between 4pm and 5pm in the engineering estimates. This seems like a small difference, but it has important implications for electricity markets given growing concern about meeting electricity demand during the early evening, when the sun sets and solar generation plunges.
When is crunch time in electricity markets?
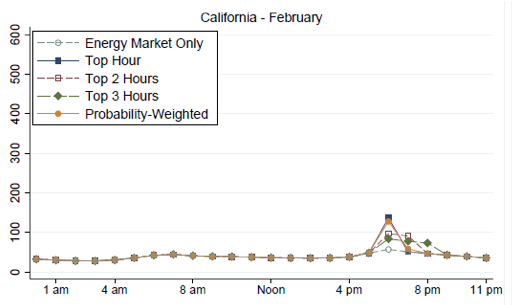
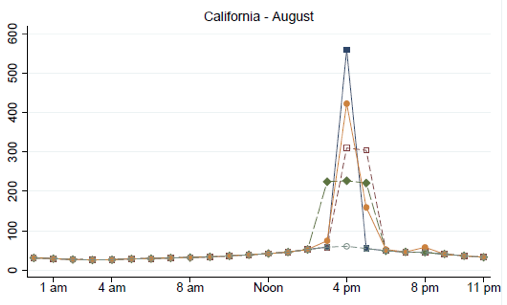
Figure 2 shows the value of electricity by hour of day in California for February and for August. It shows wholesale electricity prices, and the payments that generators receive to make sure they are available when demand is high (Bushnell 2005, Cramton and Stoft 2005, Joskow and Tirole 2007, Allcott 2013). The data series in each panel show different methods for allocating resource adequacy contract prices to high load hours. For example, 'Top hour' assigns the entire capacity value to the highest load hour in each month.
Figure 2 Wholesale electricity prices and capacity values
Notes: Figure shows the average hourly value of electricity in February and August in California, under different assumptions of capacity values. The vertical axis shows dollars per megawatt-hour.
Whichever approach we choose, summer afternoons are crunch time in California electricity markets. Depending on approach, electricity during summer afternoons is worth 5, 10, or even 20 times as much as during off-peak hours. This is not unique to California. We bring in data from Texas’ ERCOT market and five other regional markets to show that, while the exact timing of peak differs, all US markets were characterised by wild swings across hours and seasons (Callaway et al. 2015).
Energy savings and the value of electricity
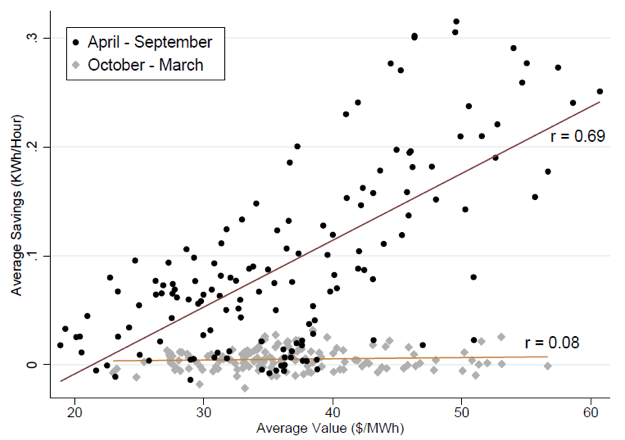
There was a strong positive correlation between energy savings and the value of electricity. Air conditioning investments yielded their largest electricity savings during summer afternoons which were peak periods for electricity markets. Figure 3 shows the correlation. Each marker corresponds to an hour-of-day by month-of-year pair (for example, 1pm to 2pm during November).
Figure 3 Correlation between savings and prices, by season
Notes: Scatterplot shows the correlation between electricity savings and California wholesale electricity prices. Each observation is an hour-of-day by month-of-year pair (for example, 1pm to 2pm during November). Electricity savings are estimated using a regression which controls for household by hour-of-day by month-of-year and week-of-sample by climate zone fixed effects. The figure also includes least-squares fitted lines for April-September and October-March observations, with the correlation indicated in text above.
During the summer, there is a strong positive correlation (r = 0.69) between savings and energy prices. The summer months include many more high-price realisations than the winter months, and air conditioning tends to deliver significant savings during these periods. There are essentially zero electricity savings in all hours during the winter, so there is little correlation between savings and prices during winter months.
Overall, we estimate that accounting for timing increased the value of air conditioner investments by 50% relative to a naive calculation that ignores timing. Including capacity payments is important in this calculation. Most of the value of electricity in ultra-peak hours is captured by forward capacity payments to generators to guarantee their availability.
Our analysis suggests that air conditioner investments will be even more valuable as the way electricity is generated shifts towards renewables. Increased solar generation makes electricity less scarce during the middle of the day, but more valuable after the sun sets (CAISO 2013). The price peak is likely to move into the late afternoon and early evening, when energy savings from residential air conditioners are largest. We conduct an informal sensitivity analysis using price and load forecast data from Denholm et al. (2015) and fing that by 2024 air conditioning investments in California could be 75% more valuable than an investment with a flat savings profile.
Energy efficiency investments
Finally we compare air conditioning to a much larger set of energy-efficiency investments, both residential and non-residential. There is a wide range of value. Residential air conditioning has the highest timing premium in most markets. Commercial and industrial heat pumps, chillers, and air conditioners have a 20-30% timing premium, reflecting the relatively high value of electricity during the day.
On the other hand, refrigerators and freezer investments have timing premiums near zero, because savings from these investments are only weakly correlated with electricity prices. Lighting also does poorly, with timing premiums of 8% (residential) and 10% (commercial and industrial). LEDs save electricity mostly during the winter and at night, when electricity tends to be less valuable.
Timing matters
Hotel rooms, airline seats, restaurant meals, and many other goods are more valuable during particular times of the year and hours of the day. The same applies to electricity. If anything, it is even more variable. Our research shows that accounting for timing significantly impacts the value of energy-efficiency investments. In particular, air conditioner investments are more valuable than other types of investments, because they deliver savings during periods when electricity is most valuable.
We hope to move the energy efficiency discussion away from total savings and toward total value. This would require more rigorous ex post analysis of energy savings based on market data. It would also require integrating savings estimates with market measures to rebalance the energy efficiency portfolio toward investments that save energy in more valuable hours.
This work also highlights the power of smart-meter data. The econometric analysis for residential air conditioning would have been impossible just a few years ago, but today more than 40% of US residential electricity customers have smart meters, up from less than 2% in 2007. This flood of new data can help to create smarter, more evidence-based energy policies.
References
Alcott, H (2013), “Real-Time Pricing and Electricity Market Design", Working Paper, NYU.
Boomhower, J and L Davis (2017), “Do Energy Efficiency Investments Deliver at the Right Time?” NBER Working Paper No. 23097.
Borenstein, S (2000), “Understanding Competitive Pricing and Market Power in Wholesale Electricity Markets'', Electricity Journal, July, pp. 49‐57.
Bushnell, J (2005), “Electricity Resource Adequacy: Matching Policies and Goals", Electricity Journal 18(8): 11-21.
Callaway, D, M Fowlie and G McCormick (2015), “Location, Location, Location: The Variable Value of Renewable Energy and Demand-Side Efficiency Resources", Energy Institute at Haas Working paper.
California Independent System Operator (CAISO) (2013), “Demand Response and Energy Efficiency: Maximizing Preferred Resources".
Cramton, P and S Stoft (2005), “A Capacity Market that Makes Sense", Electricity Journal 18(7): 43-54.
Denholm, P, M O'Connell, G Brinkman, and J Jorgenso (2015), “Overgeneration from Solar Energy in California: A Field Guide to the Duck Chart", National Renewable Energy Laboratory, Tech. Rep. NREL/TP-6A20-65023, November.
Ito, K (2014), “Do Consumers Respond to Marginal or Average Price? Evidence from Nonlinear Electricity Pricing,” American Economic Review 104(2): 537-63.
(2005), “A Primer on Electricity and the Economics of Deregulation,'' in J Griffin and S Puller (eds), Electricity Deregulation: Choices and Challenges, Chicago: University of Chicago Press, pp. 1‐11.
Joskow, P and J Tirole (2007), “Reliability and Competitive Electricity Markets", RAND Journal of Economics 38(1): 60-84.
