Policy-makers, forecasters and market analysts all face the same problem: “given the latest news, should I change my current assessment of the economic outlook?” Answering this question is particularly difficult given all the uncertainty in the economy – uncertainty about the current state of the economy, uncertainty about its true structure, uncertainty about the accuracy of the models used, and uncertainty about the quality of the available data.
These multiple sources of uncertainty have lead to one of the tenets of central banking. Assessments of the economic outlook must be backed with sound analysis of large amounts of data: “… like any other central bank, the ECB faces considerable uncertainty about the reliability of economic indicators, the structure of the economy and the monetary policy transmission mechanism, among other things. A successful monetary policy therefore has to be broadly based, taking into account all relevant information in order to understand the factors driving economic developments…” (ECB, 2004, p.50).
Forecasting at central banks is indeed a complex process involving a large suite of models, each with different goals and perspectives. While “structural models” are used for story telling and conditional forecasting of the main macro variables in the medium-term, “reduced form” models are used to perform the conjunctural assessment on the current state of the economy. The interplay between the two is, however, very important as initial conditions are crucial for the accuracy of the medium-term forecasts.
The obvious candidate to deliver a synthetic assessment of the current state of the economy would be GDP growth, but it is available only at a quarterly frequency and with a delay of about 70 days with respect to the reference period.1 GDP is also affected by revisions and short-term variations linked mainly to statistical reasons that require a careful assessment. As a result of the lack of a comprehensive and timely measure of economic activity, an effective and reliable conjunctural assessment of the economy entails processing of a wide range of data as it has long been acknowledged also by academics involved in the production of forecasts: “Econometricians who try to follow and project the overall economy as closely as possible (“Economy Watchers”) … base their main forecasts on macroeconomic models, supplemented by the frequent flow – almost daily – of indicative information” (Klein and Sojo, 1989).
A long-standing tradition relies on the so called “bridge models” to obtain an updated view of the current situation in advance with respect to the publication of GDP data, exploiting the more timely information from a few key monthly indicators; for recent applications on the euro area, see Parigi and Golinelli (2004), and Runstler and Sedillot (2003).
More recent advances in statistical and econometric techniques opened the ground to the systematic use of larger datasets. The factor-model literature proved that pooling information from a very wide number of variables and summarising it into a small set of synthetic indicators can turn out to be advantageous for forecasting purposes.2
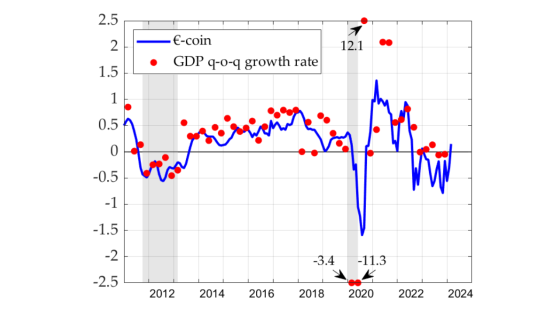
For the euro area, an application of these methods is illustrated by an index known as “€-coin.” The basics of €-coin are straightforward. The starting point is a wide range of data, those normally used by euro-area watchers (such as, for example, surveys, bonds rates, stock market indices, and industrial production). €-coin is then constructed using statistical techniques designed to distil the relevant information contained in the large amount of data available in order to estimate the underlying growth rate in the euro area.3 In short, €-coin is a “smooth, noise-free” indicator of GDP growth that:
- gives an early estimate of the euro-area growth in terms of quarter-on-quarter GDP growth;
- sheds light on the underlying growth rate of GDP (since the “temporary noise” is removed by the estimation procedure). In this respect, €-coin is not only a pure forecast of the official GDP, but also an indicator of the true “growth momentum” in the euro area.
Before trying to assess the impact on growth of the recent tensions on financial markets, it is necessary to convince ourselves that €-coin is a reasonable guide to judge the economic prospects of the euro area. To do so we can start with the recent track record of the indicator (see monitoring the economy in real time: €-coin). The real-time animation shows how €-coin accurately signalled the 2005 upturn, the peak reached in 2006 and the slowdown in activity in the second quarter of 2007.
Euro-area growth in the second quarter of 2007, though weakening, was still estimated to be around 0.7%, well above the GDP growth figures published by Eurostat (0.3%), suggesting that available official statistics may be underestimating the true growth momentum.
Since August, new data releases, especially those concerning financial and survey data, triggered a worsening of the growth outlook both in the US and the euro area.
Recent economic developments
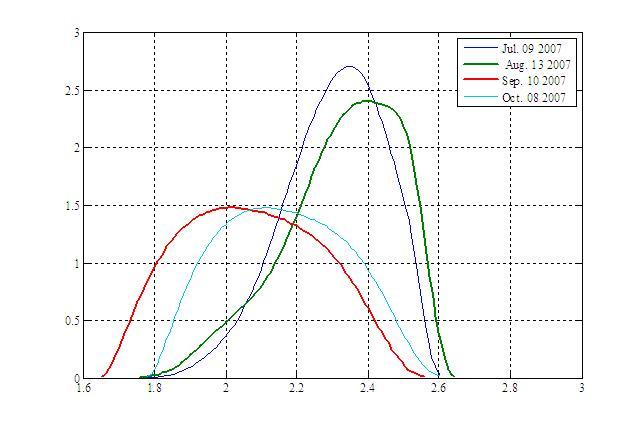
The financial distress that hit the markets last August has its roots in a small segment of the US housing market and took place in a context of robust global growth. Nonetheless, the spreading of the tensions on monetary markets and the appreciation of the euro spurred fears of a global credit crunch and provoked a reassessment of the growth prospects in the main industrial countries.4 Most recent forecasts for the euro area by major public and private institutions show a clear downward revision of the growth projections. For example, between August 13th and October 8th, private analysts, surveyed by Consensus Forecasts, downgraded their expectations regarding euro area GDP growth in 2008 by 0.3 percentage points on average, from 2.3% to 2.0% (Figure 1 reports the nonparametric estimate of the distribution of private analysts expectations).
Figure 1: Shifting views: 2008 growth forecasts for the euro area (1)
Note: (1) Non parametric kernel density of forecasts on GDP growth in 2008, as collected by Consensus Forecasts in the dates indicated.
It is still too early to draw any definite conclusion on the effects of the financial turmoil. It is nonetheless interesting to have a way of assessing the evolution of euro area growth prospects as these effects unfold. Forecasts are constantly scrutinised and updated as new information becomes available, but, confronted with an almost constant flow of news, it is far from obvious which data are really relevant and how to weight them.
What does €-coin say on the recent economic developments?
Here we show how €-coin – a synthetic index designed to capture the information contained in a large dataset to give an up-to-date assessment of current underlying euro-area GDP growth – can help.
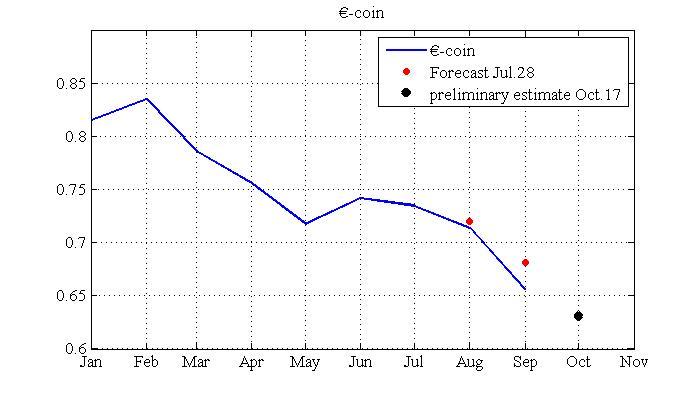
This information – exploited by €-coin – resulted in a slight decline of the indicator in September. To identify the different impact of these news, we compared the actual estimate of €-coin in the month of August with the one we would have obtained if the “negative shock” in August’s financial and survey data had not occurred. This counterfactual exercise can be implemented by substituting the actual data for August and September with their forecasts made in July, and obtaining an alternative estimate of €-coin for the month of August. The two estimates are shown in Figure 2. The news content of August’s financial and survey data indeed worsened the growth prospects for the euro area, although its marginal impact was fairly modest.
Figure 2: €-coin and the impact of the most recent data(1)
Note: (1) The solid blue line provides the official €-coin indicator as estimated every month. The dashed red line represent the €-coin forecasts for August and September that would have been obtained on July 28th. The black diamond provides a preliminary estimate of €-coin for the month of October as of October 17th.
The last figure relative to October is a preliminary estimate as of October 17th and points to a further weakening of the growth momentum. The underlying growth rate of the euro area economy is still estimated to be slightly higher than 0.6% at a quarterly rate, although it is still too early to draw definite conclusions. A better real-time picture of the impact on euro-area growth prospects will be given by future €-coin releases (to be released on October 29th, November 29th).
In judging these results, it should always be remembered that €-coin, by making the best use of the available data, has proved to be a good starting point to gauge the euro area economic outlook, but it is not a substitute for sound economic analysis, as events, not accounted for in the available data, might well affect the economic performance of the euro area. As a famous physicist once pointed out, “Not everything that can be counted counts, and not everything that counts can be counted”.
This article also appears in Eurointelligence.
References
Altissimo F., R. Cristadoro, M. Forni, M. Lippi and G. Veronese (2007), “Eurocoin: tracking economic growth in real time” in Banca d’Italia, Temi di discussione n. 631 (also published as CEPR WP n. 5633).
European Central Bank (2004) “The Monetary Policy of the ECB”.
Forni, M., M. Hallin, M. Lippi, and L. Reichlin (2005), “The generalized dynamic factor model: one-sided estimation and forecasting”, Journal of the American Statistical Association 100 830-40.
Golinelli, R., and G. Parigi (2007): The Use of Monthly Indicators to forecast quarterly GDP in the short run: an application to the G7 countries," Journal of Forecasting, 26, 77-94.
Klein, L.R. and E. Sojo (1989). “Combinations of High and Low Frequency Data in Macroeconometric Models”, in L.R. Klein and J. Marquez (eds.), Economics in Theory and Practice: An Eclectic Approach. Kluwer Academic Publishers, pp. 3-16.
Runstler, G., and F. Sedillot (2003): Term Estimates of Euro Area Real GDP by Means of Monthly Data," Working Paper Series 276, European Central Bank.
Stock, J.H. and M.W. Watson (2002), “Forecasting using principal components from a large number of predictors”. Journal of the American Statistical Association 97, 1167-79.
Footnotes
1 45 days if we consider the “flash” estimate.
2 There is a growing literature that provides methods to synthesize the information content of large dataset, see Stock and Watson, 2002 and Forni, Hallin, Lippi and Reichlin, 2005, among others.
3 In contrast to other popular indicators, €-coin is broadly based, focused on the euro area as a whole and available on a timely basis each month. More importantly, it is not just a “qualitative index”, but it is directly related to GDP growth and anticipates GDP releases by 2-3 months. For a comprehensive study of the properties of €-coin, see Altissimo et al. (2007).
4 There have recently been a few Vox columns dealing with the impact of the financial crises (Tommaso Monacelli). For a thorough description of the events see (Stephen Cecchetti).


