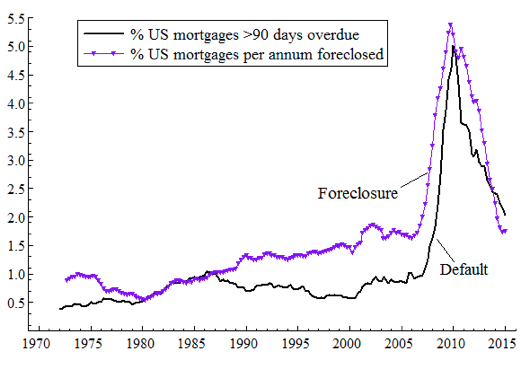
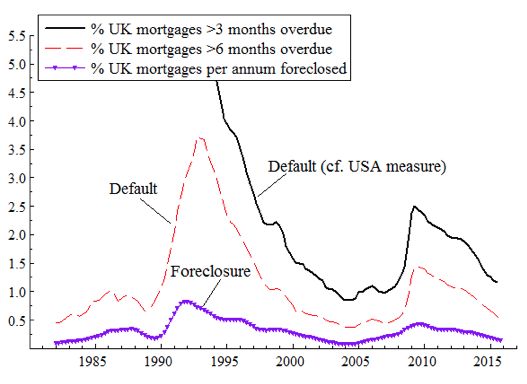
The contrasts between the US and the UK mortgage delinquency and foreclosure rates are striking. The US data in Figure 1 show an unprecedented recent default crisis: annual foreclosures peak at around 5.5% and mortgages payment delinquencies (90 days or more) at around 5%. In contrast, the recent UK data suggest a relatively mild crisis (Figure 2). However, in the early 1990s, the UK delinquency rate for 3-month defaults (comparable to the US 90-day rate) probably peaked at over 5% (just before records began on this measure). Even then, the annual flow into foreclosures was below the levels for a fairly normal year in the US.
Figure 1 US mortgage foreclosure and payment delinquency rates1
Figure 2 UK mortgage foreclosure and payment delinquency rates2
Fuster and Willen (2012) study the probability of entering foreclosure proceedings using US mortgage micro-data, and highlight the impact of negative equity and of variations in interest rates on adjustable rate mortgages. We confirm these findings on aggregate UK data. In a new paper, we model jointly two measures of payment delinquency rates and the rate of flow into foreclosure (Aron and Muellbauer 2016). We find that there were three key economic drivers: the debt service ratio (a measure of debt service costs relative to income), the proportion of homes in negative equity (where the value of the home is less than that of mortgage debt), and the unemployment rate. Previous lending quality and access to refinancing possibilities, government income support for borrowers with payment problems, and the forbearance policies exercised by lenders also play a role.
Explaining the lesser crisis in the UK
With this empirical analysis, the strikingly less severe mortgage crisis in the UK can be explained. With mainly adjustable rate mortgages in the UK, the unprecedented cuts in the base rate in 2008-09 quickly brought down mortgage payments for most borrowers. This supported consumer spending, preventing a deeper recession. House prices fell far less in most of the UK than in the US, partly because there was no pre-crisis building boom, and partly because average lending quality towards the end of the preceding credit boom was better than in the US. With no tax relief allowed on mortgage payments for owner-occupiers in the UK, UK borrowers also had lower incentives to take on higher leveraged debt than in the US. As a result, negative equity was far lower than in the US. Furthermore, our estimates suggest that government intervention in the form of more generous income support for borrowers with payment problems lowered the foreclosure rate by at least 21%, and increased forbearance by lenders lowered the rate by perhaps 13%. The far lower long-run level of foreclosures in the UK is almost certainly influenced by the fact that UK mortgages are ‘full recourse’, meaning that lenders can access the other assets and the incomes of the borrowers for up to seven years until the debt is paid. In contrast, some US states have ‘no recourse’ mortgages – borrowers’ obligations cease after the keys are returned and they effectively walk away from the debt (hence the phrase, ‘jingle mail’). Even in states without such laws, the convention among US lenders appears to be not to attempt full recourse proceedings.
In the US, with mainly fixed-rate mortgages, debt service ratios did not fall rapidly after the mortgage crisis began. It seems likely that increased payment delinquencies were driven mainly by negative equity – borrowers expecting to foreclose and seeing no point in keeping up with payments – and higher unemployment. The trough-to-peak rise in the unemployment rate was 7% in the US, but 4% in the UK.
Why the UK’s 2009-11 mortgage crisis was so much less severe than that of 1991-95
With mainly floating rate mortgages, a serious risk for borrowers is that rates may rise. The UK bank base rate doubled from 7.5% to 15% from 1987 to 1990, following the house price and credit boom of the 1980s, and mortgage rates followed. This was partly induced by the higher rates stemming from German reunification in 1990. With inflation high and the UK in the Exchange Rate Mechanism, it proved impossible to bring rates down rapidly. The UK left the ERM in September 1992, unemployment rose sharply, and house prices experienced substantial falls. We estimate that around 20% of mortgages were in negative equity at the worst point, and payment arrears (delinquencies) reached record proportions (Figure 2). Cumulatively, 3% of mortgage borrowers suffered mortgage repossessions (foreclosures) in the 1990s. The subsequent boom, ending in mid-2007, again increased the proportion of households with overstretched budgets and over-extended debts relative to their assets. However, at its peak in early 2009, the UK repossessions rate reached only about half that of the 1990s repossessions peak. A deeper UK repossessions crisis was avoided mainly through dramatic monetary policy interventions, lenders’ forbearance policy, and increased government income support for those with payment difficulties. A key difference from 1990-92 was that there was low inflation and a flexible exchange rate, and the Bank of England’s policy interest rate (base rate) could be brought down quickly to half a percentage point. This rapidly lowered mortgage rates, and hence the debt service ratio for borrowers, given the predominance of adjustable rate mortgages in the UK. House prices were supported, preventing major rises in the proportion of households with negative equity. This played a key role in stabilising mortgage markets and the wider economy. Indeed, Aron et al. (2012) provide UK evidence for the direct impact of interest rates on consumption and their indirect impact via housing collateral.
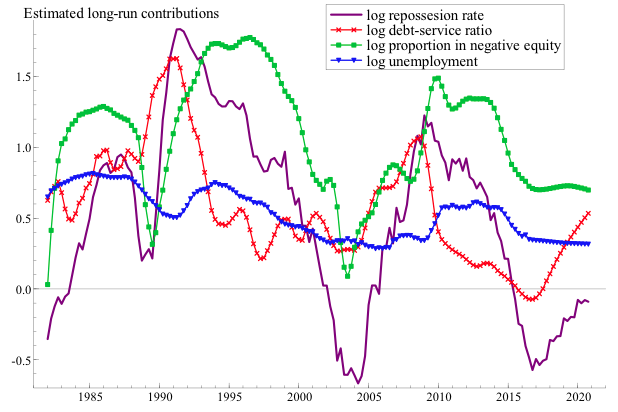
Figure 3 illustrates the model-fitted long-run contributions of negative equity, the debt service ratio, and the unemployment rate to variations in the repossessions rate (in logs). Comparing 2009-11 to 1991-96, note the rapid fall of the debt service ratio (and from a lower level), and the shorter duration and lower level of the proportion in negative equity.
Figure 3 Estimated long-run contributions of key explanatory variables to the log repossessions rate
Motivation and innovations in our study
In the absence of micro-data in the public domain, we estimated new aggregate models for the UK’s mortgage repossessions and arrears with quarterly data for 1983-2014 that were motivated by a conceptual double trigger framework for foreclosures and payment delinquencies (Aron and Muellbauer 2016). An important innovation is that difficult-to-observe variations in loan quality and access to refinancing, and the shifts in lenders’ forbearance policy, are estimated by common latent variables in a system of equations for arrears and repossessions. This greatly improves on the flawed but widespread use of loan-to-value measures. We also introduce, for the first time in the literature, a theory-justified estimate of the proportion of mortgages in negative equity as a key driver of aggregate repossessions and arrears. This measure is based on an average debt-to-equity ratio, corrected for regional deviations, and uses a functional form for the distribution of the debt-to-equity ratio checked on Irish micro-data from the Bank of Ireland, and Bank of England snapshots of negative equity (e.g. Bank of England 1992). We further systematically address serious measurement bias in the ‘months-in-arrears’ measures, neglected in previous UK studies. Finally, a universal assumption in previous UK studies (e.g. Brookes et al. 1994) of a proportional relationship between repossessions and arrears is relaxed in our system.
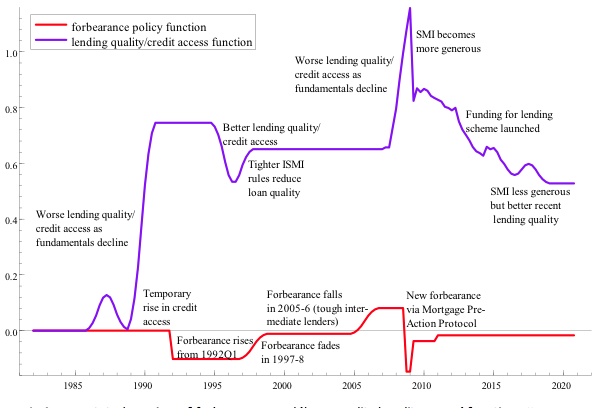
Arrears and repossessions are estimated jointly in a system of equations together with ‘loan quality/credit access’ (the LQ function) and forbearance policy proxies (the FP function). The LQ indicator measures the impact on current rates of repossessions and arrears of variations in earlier lending standards, in access to refinancing, and in government income support for borrowers with payment difficulties. The FP proxy captures ‘leniency’ of lenders that lowers the rate of repossession but raises the rate of arrears. The LQ and FP functions are mainly linear combinations of time dummies. Cross-equation constraints are imposed on the arrears and repossessions equations through the common LQ and FP functions. This latent variables approach improves on the widespread use of loan-to-value measures for first mortgages as indicators of loan quality, as these are not comparable over time and omit further advances of credit. The resulting functions in Figure 4 satisfy the priors for ‘loan quality/credit access’ and forbearance policy, in terms of the dating of shifts and the expected effects on repossessions and arrears, as explained in our paper.
By including these proxies for ‘loan quality/credit access’ and forbearance policy, just five variables are needed in the parsimonious empirical model to explain the history of arrears and repossessions over 1983-2014 and to assess future trends. Highly significant effects on aggregate rates of repossessions and arrears are found for the aggregate debt-service ratio, the proportion of mortgages in negative equity, and the unemployment rate. Economic forecast scenarios to 2020 highlight risks faced by the UK and its mortgage lenders, illustrating the usefulness of the approach for bank stress-testing. Figure 3 illustrates one forecast scenario to 2020.3 The demonstrated sensitivity of the outlook to variations in interest rates through the debt service ratio is particularly striking. The mortgage default module in one of the more developed models for financial risk assessment – the RAMSI model developed at the Bank of England (Alessandri et al. 2009) – could be considerably improved using the approach in our paper.
Figure 4: An annotated version of forbearance and ‘loan quality/credit access’ functions4
Notes: FAS = Financial Services Authority; ISMI = Income Support for Mortgage Interest; SMI = Support for Mortgage Interest.
Macro- versus micro-data on mortgage default and delinquency in the UK and the US
A careful study of the aggregate data is pertinent in the UK, given the paucity of micro-data on mortgage defaults in the public domain. By contrast with a long history of US empirical literature on borrower mortgage default or lender foreclosure, the set of UK empirical studies on repossession and arrears is strikingly limited. Reviews of the US literature into the 1990s on mortgage default and delinquency (e.g. Quercia and Stegman 1992), and a special focus on empirical testing of option theoretic models of default (Vandell 1995), reveal even then a wealth of micro-data based studies from both lender and borrower perspectives. The limited quality and availability of corresponding micro-data sets in the UK has constrained the possible analyses. The only micro-candidate for a random sample is the British Household Panel Study (BHPS), but these data are sparse and untimely, and there are problems drawing aggregate implications from them. This accounts for the small number of (predominantly macro-based) UK empirical studies, employing a hybrid of the recent default/delinquency theories in reduced form regression models.
Quercia and Stegman (1992) characterise the evolution of mortgage default studies in the US in a typology of three generations. The first generation, from the 1960s onwards, focused from a lender’s perspective on simple correlations or empirical regression models capturing, at loan origination, the characteristics of the mortgages (e.g. loan-to-value ratio, interest rate and mortgage term) and of borrowers (e.g. family size, location, marital status, junior financing and characteristics of employment) that might be correlated with later default. A second generation of empirical models derived from theoretical models that instead emphasised factors influencing the borrowers’ decisions on payment, prepayment, delinquency, or default. A special case is the large literature on option theoretic models from the mid-1980s, in its simplest form abstracting from transactions costs (‘frictionless’ models), where prepayment is treated as a call option and default as a put option in a competitive market. Such models predict immediate default if a property’s value drops to the level of the mortgage value minus a small margin depending on house price volatility (‘ruthless default’; see Vandell 1995). These models exclude borrower characteristics. Related studies suggest a role for ‘trigger events’ (Riddiough 1991), or crises affecting income (such as divorce or loss of employment), that when intersecting with marginal equity, may precipitate the move from a delinquent state with negative equity to default. This introduces a role for ability-to-pay factors in addition to equity. The so-called third generation of models mainly represent a technological improvement on the second generation models in applying proportional hazard models to estimate default probabilities, and utilising a measure of mortgage risk that better reflects lenders’ concerns: expected mortgage loss rather than default rates, as in most second generation studies.
The predominant empirical model in the literature stems from the second and third generational research and finds an important role for net equity in default risk, but also some evidence for borrower effects and transactions costs, though these effects are less well understood Examples focused on the subprime crisis are Foote et al. (2008), Gerardi et al. (2008), Bajari et al. (2009), Haughwout et al. (2009) and Bhutta et al. (2010). However, as Bajari et al. make clear, the neglected factors of lending quality or credit constraints do not find an obvious place in the utility-maximising framework underlying second generational and option theoretical models. These require an extension to such models.
These US studies are entirely based on micro-data. Deriving aggregate implications from such studies is far from straightforward. One problem is that most micro-data sets are not representative of all US households with mortgages. A second problem is that, in most studies, data on debt levels are restricted to the initial loan and do not capture later, additional borrowing or refinancing. A third problem is that structural changes in lending conditions may have altered loan conditions in ways not captured by observables. Also, if changes in the macroeconomic environment are tracked by time dummies in micro-panels, then macro implications from such studies are not fully identified. Despite the now widespread availability of loan level data, it can be argued that analysis of aggregate data in the US would be a useful complement. Loan level datasets in the US do not equal the universe of all loans. Securities data cover only a subset of the market, which before 2002 was a small subset; service data are broader, but only reliable from 2005 and cover only two-thirds of the market. For a long national time series, the only option is the Mortgage Bankers Association National Delinquency Survey (NDS), from the early 1970s, but this only provides the sort of aggregates we use for the UK. With a combination of Federal Housing Finance Agency (FHFA) price indices (back to the 1970s), the Federal Reserve Financial Obligations Ratio (back to 1980) and the NDS, one could construct a model of aggregate delinquency rates for the US going back at least as far as 1980.
In our study, aggregate debt data used to measure debt service ratios and to infer negative equity includes further loans. The latent variable approach to imputing loan quality, access to credit, and policy shifts is designed to capture structural changes affecting loan defaults, jointly with the key macroeconomic variables. Data on defaults by vintage of issue would be particularly helpful to enhance our models, particularly at the level of individual lenders, where bank stress-testing is required. The ‘loan quality/credit access’ shifts then could be better identified, and with such data, it should also prove possible to better link lending quality measures with observable loan characteristics. The modelling framework, with some adaptation, is also suitable for drilling down further to the level of individual loan histories, where the estimated ‘loan quality/credit access’ and forbearance policy dummies would be valuable controls to analyse time-varying drivers of arrears and repossession transitions.
Models linking macro-variables and micro-credit indicators with rates of mortgage default potentially have much to offer the stress-testing systems currently under development by central banks and prudential supervisors (see Foglia 2009), and would also be highly relevant for developing early warning systems. One priority for future work is to endogenise house prices and the aggregate mortgage stock – checking for possible feedbacks from repossessions, and perhaps arrears – onto house prices and the mortgage stock, so capturing an important linkage in the financial accelerator (discussed further in Duca et al. 2010).
Authors’ note: Support is acknowledged from the Department of Communities and Local Government (DCLG) for whom the authors forecast UK arrears and repossessions during 2010-2014; the Economic and Social Research Council via the UK Spatial Economics Research Centre; and the Open Society Foundation and Oxford Martin School. We are grateful to the Council of Mortgage Lenders (CML) for data
References
Allesandri, P., Gai, P., Kapadia, S., Mora, N., and Puhr, C. 2009. Towards a Framework for Quantifying Systemic Stability, International Journal of Central Banking 5(3), 47-82.
Aron, J., Duca, J., Muellbauer, J., Murata, K. and Murphy, A. 2012. Credit, housing collateral and consumption in the UK, U.S., and Japan, Review of Income and Wealth 58 (3): 397–423, 2012.
Bajari, P., Chu, C.S., Park, M., 2009. An Empirical Model of Subprime Mortgage Default from 2000 to 2007, NBER Working Paper 14625.
Aron, J., and Muellbauer, J. 2016, Modelling and Forecasting Mortgage Delinquency and Foreclosure in the UK, Oxford University, Dept. of Economics, Working Paper 793. Also available as CEPR Discussion Papers 11236. Final version in Journal of Urban Economics 94, July 2016, 32–53.
Bank of England, 1992. Negative equity in the housing market. Bank of England Quarterly Bulletin August, 266-268.
Bhutta, N., Dokko, J., Shan, H., 2010, The Depth of Negative Equity and Mortgage Default Decisions, Federal Reserve Board, Finance and Economics Discussion Series Working Paper 2010–25.
Brookes, M, Dicks, M., Pradhan, M., 1994. An Empirical Model of Mortgage Arrears and Repossessions, Economic Modelling 11, 134-144.
Duca, J., Muellbauer, J., Murphy, A., 2010. Housing Markets and the Financial Crisis of 2007-2009: Lessons for the Future, Journal of Financial Stability, 6 (4), 203-217.
Foglia, A., 2009. Stress Testing Credit Risk: A Survey of Authorities Approaches, International Journal of Central Banking 5 (3), 9-45.
Foote, C., Gerardi, K., Willen, P., 2008. Negative Equity and Foreclosure: Theory and Evidence, Journal of Urban Economics 64 (2), 234–45.
Fuster, A. and Willen, P. 2012, rev.2015. Payment Size, Negative Equity, and Mortgage Default, NYRB, Staff Report 582
Gerardi, K., Lehnert, A., Sherlund, S.M., Willen, P., 2008. Making Sense of the Subprime Crisis. Brookings Papers on Economic Activity 2, 69-159.
Haughwout, A.F., Peach, R., Tracy, J., 2008. Juvenile delinquent mortgages: Bad credit or bad economy? Journal of Urban Economics 64(2), 246-257.
Kau, J.B., Keenan, D.C., Muller, W.J., Epperson, J.F., 1992. A Generalized Valuation Model for Fixed-Rate Residential Mortgages, Journal of Money, Credit and Banking 24, 279-99.
Kau, J.B., Keenan, D.C., Kim, T. 1993. Transactions Costs, Suboptimal Termination, and Default Probabilities for Mortgages, Journal of the America Real Estate and Urban Economics Association 221, 247-63.
Quercia, R., Stegman, M., 1992. Residential mortgage default: A review of the literature, Journal of Housing Research 3, 341–379.
Riddiough, T., 1991. Equilibrium mortgage default pricing with non-optimal borrower behavior, PhD dissertation, University of Wisconsin.
Vandell, K. D., 1995. How Ruthless is Mortgage Default? A Review and Synthesis of the Evidence, Journal of Housing Research 6, 245-264.
Endnotes
[i] Data come from the Mortgage Bankers Association National Delinquency Survey. Foreclosure rates are numbers entering foreclosure proceedings scaled by the number of first-lien mortgages. Delinquency rates are numbers of first-lien loans 90 or more days overdue scaled by the number of loans.
[ii] Data come from the Council of Mortgage Lenders, see Aron and Muellbauer (2016) for details.
[iii] Based on central forecasts of the economic drivers by Oxfordeconomics.com.
[iv] The scaling of the latent variables measures the long-run impact on the log of the repossessions rate and is comparable to Figure 3.
