Net interest payments on the US federal debt play such a prominent role in the Congressional Budget Office's (CBO) Budget and Economic Outlook: Fiscal Years 2010-2020 that a graph of the series illustrates the publication's front cover. According to this report, last year the US federal government paid $187 billion in net interest on $7.544 trillion of Treasury debt, implying a positive interest rate of about 2.5%. Curiously however, 2009 was not a terrific year to be an investor of Treasury securities. Many Treasury Bond mutual funds lost money, with the benchmark Barclays US Treasury Bond Index falling 3.9% over the year. Long-term bond holders were hurt particularly hard, as rising rates imposed large capital losses.
How can it be that the government reports positive interest payments while its creditors claim to have lost money? It turns out that net interest payments on the federal debt as reported by the Treasury, National Income and Product Accounts, and CBO is a flawed measure of government borrowing costs. As noted earlier by Robert Eisner (1986), Henning Bohn (1992), and others, the number the government reports as net interest does not correspond the interest payments economists put in the government budget constraint; instead it is the sum of all the coupon payments on the Treasury notes and bonds and the capital gains of the zero-coupon Treasury bills. This arithmetic mismeasures the government's interest payments by failing to account properly for real capital gains and losses government creditors receive due to changes in inflation, interest rates, and the maturity structure of the debt. Coupon payments should not be viewed as pure interest payments – they are part principal repayments, part interest payments.
To measure the government’s interest payments accurately, we have built our own accounting scheme using market prices and quantities held by the public for every marketable Treasury security since 1941 (Hall and Sargent, 2010). Our calculations take into account inflation, fluctuations in the term structure, and changes in the maturity structure of the debt.
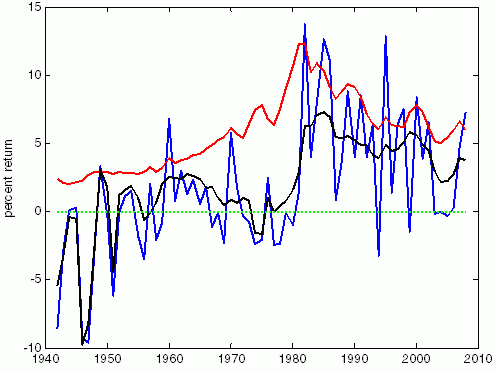
In Figure 1, we contrast the US federal government’s official interest payment series with our series using annual end of the year data from 1941 to 2008. We report both our measure of interest paid (the blue line) and the government's reported interest payments (the red line) as percentages of the market value of debt. Thus, both series can be viewed as rates of return.
Figure 1. A comparison of the official interest payments and our estimates of interest payments
Note: The blue line is our computed interest payments on the debt. The red line is the officially reported interest payments. Both series are reported as percentages of the total market value of publicly-held Treasury debt. The black line is the red line minus the inflation rate.
Computed correctly, the return on US Treasury debt is lower on average and considerably more volatile than the official reported interest costs. The official interest payments average 5.8% of the debt while our measure of the real return on the debt averages 1.7%. If we subtract the inflation rate from the officially reported interest payments (the black line), the two series have roughly the same mean (2.0 versus 1.7).
In contrast to the officially reported net interest payment series, our measure of the return on government debt demonstrates some striking outcomes.
- First, there were large negative returns immediately after World War II as inflation surged with the lifting of price controls.
- Second, during the early 1980s, when, perhaps unexpectedly, Paul Volcker brought down inflation, bondholders – particularly long-term bond holders – received large positive returns. Many who point to the 1970s as a time during which the US was able to pay low returns to its creditors through inflation often fail to acknowledge the large returns many of those same creditors received when inflation fell in the early 1980s.
- Third, annual real returns became considerably more volatile in the two and half decades after 1980 – a period of low volatility in GDP growth often described as the Great Moderation.
The misreporting of US government borrowing costs leaves open the possibility of manipulation. The government could drive its measure of net interest payments to zero every period by perpetually rolling over, let us say, zero-coupon 10 year bonds. Such bonds would never pay coupons and never mature – each period they would be repurchased as nine year zero-coupon bonds and reissued as fresh 10 year zero-coupon bonds. Though the government accounts would put interest payments at zero, in truth the government would still pay interest in the economically relevant sense determined by the government budget constraint.
References
Bohn, Henning (1992), “Budget Deficits and Government Accounting”, Carnegie-Rochester Conference Series on Public Policy, Vol. 37:1-83.
Eisner, Robert (1986), How Real is the Federal Deficit? The Free Press, New York.
Hall, George and Thomas Sargent (2010), “Interest Rate Risk and Other Determinants of Post-WWII U.S. Government debt/GDP Dynamics”, NBER Working Paper 15702.


