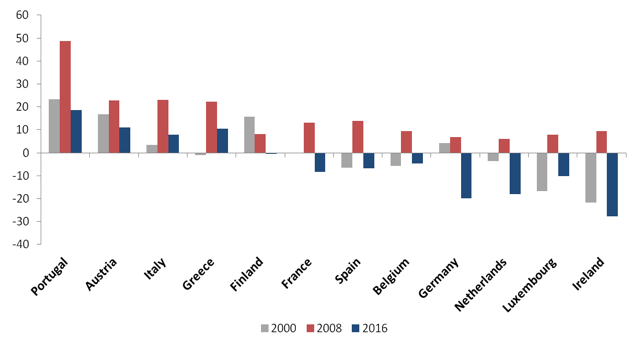
It is well documented that the build-up of large external imbalances across the Eurozone during the first decade of the euro was partly due to the overvaluation of peripheral countries’ currencies against those of the core (Baldwin and Giavazzi 2015). In a recent paper (Couharde et al. 2017b), we documented that the evolution of currency misalignments has reversed in the periphery since the Eurozone crisis, but the dispersion across the Eurozone remains large (Figure 1).
Figure 1 Currency misalignments within the Eurozone (%)
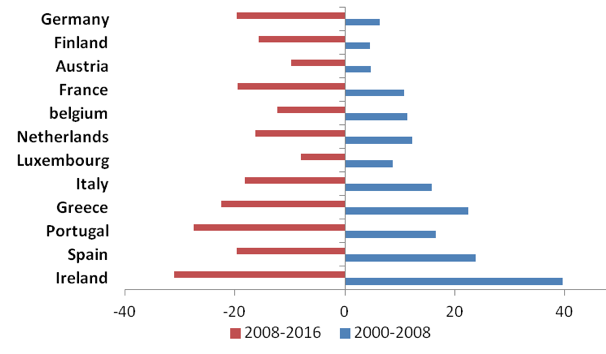
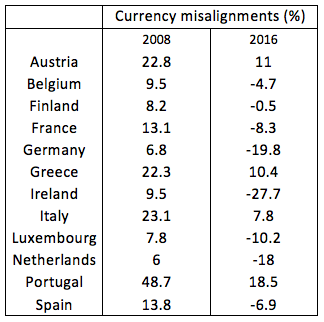
In fact, the periphery has experienced a significant real depreciation from 2012 after the implementation of austerity programmes, but meanwhile, core countries have undergone significant real depreciations too (Figure 2). As a consequence, some core countries are now undervalued, such as Germany and the Netherlands (Table 1). In sum, all euro members have experienced a real depreciation, a fact that slows down the restoration of external balances in the Eurozone.
Figure 2 Changes in the real effective exchange rates
Table 1 Currency misalignments
Note: Positive values correspond to over-valuation; negative values correspond to under-valuation.
Source: EQCHANGE database (CEPII)
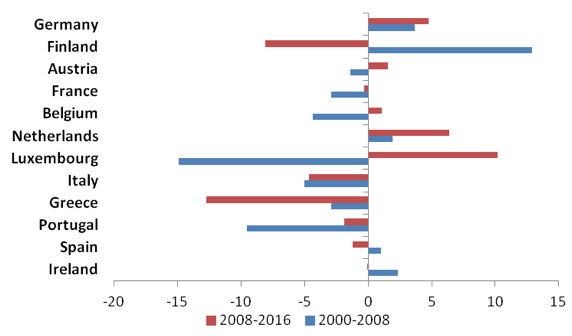
Unfortunately, this is not the only bad news. Not only is the dispersion still large, but the analysis also reveals a most likely unsustainable evolution. Real exchange rates of the periphery are less overvalued because prices have decreased after the austerity programmes, while those of the core became undervalued because fundamentals have improved (Figure 3).
Figure 3 Changes in the equilibrium exchange rates
This analysis of currency misalignments in the Eurozone draws from a new database developed by CEPII that we presented in another recent paper (Couharde et al. 2017a). The practice of estimating equilibrium exchange rates has a long-standing tradition in applied and policy-oriented analysis. Yet academics and practitioners estimate their own measure when needed, while journalists and policymakers rely on scarce public information with inconsistent frequency, time, and country sample. In turn, EQCHANGE, the new CEPII database includes: (i) nominal and real effective exchange rates, and (ii) equilibrium real effective exchange rates for more than 180 countries from 1973 onwards.1 To our knowledge, it is the longest and largest publicly available database on equilibrium exchange rates and corresponding misalignments.
Current public information on currency misalignments has important limitations. First, the 'Big Mac index' published by The Economist since 1986 gives an indication of the extent to which a currency is over- or undervalued against the US dollar according to the law of one price.2 As tractable as it may be, the Big Mac index assesses the purchasing power gap between one country and a single partner – the US – and in terms of a single good (this shortcoming is acknowledged by The Economist, commenting that “the Big Mac index is merely a tool to make exchange-rate theory more digestible”). This measure is currently calculated for 56 countries at a semi-annual frequency and can be downloaded from the website of The Economist.
In order to address the limitations just mentioned, subsequent measures have introduced two major improvements. First, currency misalignments can be computed to account for multilateral economic exchanges. The misalignment of a currency is measured against a basket including the currencies of all or main trade partners instead of only the US. Second, the over- or undervaluation of a currency can be assessed to account for multiple macroeconomic factors. More precisely the misalignment can be derived from the estimation of an equilibrium value of the real effective exchange rate, which varies over time, reflecting changes in economic fundamentals. There are various approaches to estimating equilibrium exchange rates, which are usually classified into three complementary groups (MacDonald 2000, Driver and Westaway 2004):
- The macroeconomic balance approach calculates the difference between the current account projected over the medium term at prevailing exchange rates and an estimated equilibrium current account, or ‘CA norm’.
- The behavioural equilibrium exchange rate (BEER) approach estimates the equilibrium exchange rate as a function of medium- to long-term fundamentals.
- The external sustainability approach calculates the difference between the actual current account balance and the balance that would stabilise the net foreign asset position of the country at some benchmark level.
The IMF Consultative Group on Exchange Rate Issues (CGER) has combined these three complementary approaches to assess exchange rate misalignments for a number of advanced economies and emerging market countries (Lee et al. 2008). However, the information is produced at an irregular frequency, it concerns a limited number of countries only, and the panel of countries varies across studies. In sum, the lack of time and geographic consistency limits its use in historical studies. The American Peterson Institute for International Economics publishes estimates of fundamental equilibrium exchange rates based on the macroeconomic balance approach. Their measure, developed by Cline and Williamson (2008), is available for 34 countries since 2008 at a semi-annual frequency. Since Bénassy-Quéré et al. (2004), CEPII has also published several estimates of currency misalignments based on the macroeconomic balance and the BEER approaches.
In sum, each aforementioned institute computes its own equilibrium real exchange rates and corresponding currency misalignments, but so far there was no publicly available database for a consistent and large sample of countries over a long period of time. In order to bridge the gap, CEPII has developed EQCHANGE, which contains two sub-databases.
The first sub-database provides indices of nominal and real effective exchange rates for 187 economies over the 1973-2016 period. The effective exchange rates indices are calculated for two panels of trade partners (186 and top 30) and using three alternative weighting systems (see the details in Couharde et al. 2017a). The substantial enhancement introduced by EQCHANGE is without doubt the second sub-database, which includes equilibrium real effective exchange rates and corresponding currency misalignments. We have committed to the BEER approach because the associated macroeconomic data needed for the computation exist for the vast majority of countries in the world (182 countries) and over a reasonably long time-span (from 1973 onwards). In turn, the two alternative approaches would have restrained the range of countries and time span. Currency misalignments – which are deduced from the difference between real effective exchange rates and their equilibrium values – are calculated in different ways depending on: (i) the definition of real effective exchange rates indices (based on three possible weighting schemes), (ii) the specification of the equilibrium exchange rate model, and (iii) the sample of countries. EQCHANGE will be updated at a semi-annual frequency.3
As the IMF puts it, using a broad range of indicators provides the best possible estimate of the equilibrium exchange rate level. Therefore, an extension of EQCHANGE for the future will consist of adding estimates based on the two alternative approaches.
In summary, we hope that time- and sample-consistent public information will contribute to documenting key debates such as currency misalignments and their impact on global and/or regional imbalances, mercantilist exchange rate management, the change in competitiveness, the drivers of trade and capital flows, and the resources reallocation between the tradable and the non-tradable sectors, to name but a few.
References
Baldwin, R E and F Giavazzi (2015), The Eurozone Crisis: A Consensus View of the Causes and a Few Possible Remedies, CEPR Press.
Bénassy-Quéré, A, P Duran-Vigneron, V Mignon and A Lahrèche-Révil (2004), “Burden Sharing and Exchange Rate Misalignments within the Group of Twenty”, CEPII Working Paper, 2004-13.
Cline, W R and J Williamson (2008), “New estimates of fundamental equilibrium exchange rates”, Policy Brief 08-7, Peterson Institute for International Economics, Washington, DC.
Couharde, C, A L Delatte, C Grekou, V Mignon and F Morvillier (2017a), “EQCHANGE : A World Database on Actual and Equilibrium Effective Exchange Rates”, CEPR Discussion Paper 12190.
Couharde, C, A L Delatte, C Grekou, V Mignon and F Morvillier (2017b), “Sur- et sous-évaluations de change en zone euro: vers une correction soutenable des déséquilibres?”, La Lettre du CEPII, CEPII Research Center, 375.
Driver, R, and P F Westaway (2004), “Concepts of equilibrium exchange rates”, Bank of England Working Paper no. 248.
Lee, M J,M J D Ostry, M A Prati, M L A Ricci and M G M Milesi-Ferretti (2008), “Exchange rate assessments: CGER methodologies”, paper no. 261, International Monetary Fund.
MacDonald, R (2000), “Concepts to Calculate Equilibrium Exchange Rates: An Overview”, Discussion paper 3/00, Economic Research Group of the Deutsche Bundesbank.
Endnotes
[1] Data can be downloaded here.
[2] For example, in July 2017, a Big Mac in Canada costs 12.2% less than in the US, a fact that translates in the Big Mac index as an undervaluation of the Canadian dollar by 12.2% against the US dollar.
[3] The semi-annual frequency update can be carried out for advanced economies and several developing countries. For the remaining countries, an annual revision of the data will be implemented.


