India and other South Asian countries have experienced high growth rates over the past decade. What has this meant for poverty reduction across different regions of South Asia? Analysis of Indian data has generated concern about the lack of convergence between rich and poor regions – richer states have grown faster so that inequality across states is increasing (Ahluwalia 2000, Kochhar et al. 2006, Subramanian 2011). Does this mean that poverty rates and social outcomes are also diverging across states? Are there poverty traps? Can poverty converge if incomes diverge? We examine some of these questions in the recently published book, The Poor Half Billion in South Asia (Ghani 2010).
Convergence in poverty
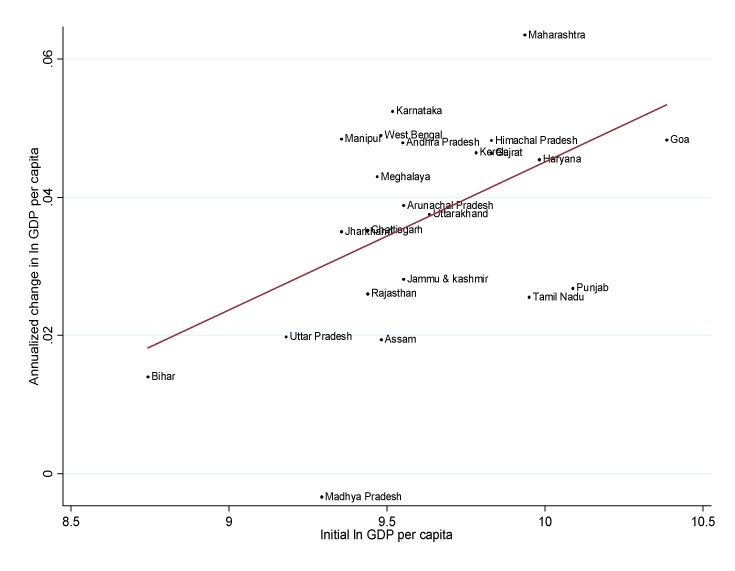
Figure 1 shows that per capita income is not converging across states within India. Over the period 2000–2005, states with higher initial per capita GDP show higher rates of economic growth (Ghani et al. 2010). However, this does not necessarily mean that poverty rates are not converging. There is a long literature on the complex and non-linear relationship between growth and poverty, which arises due to differences in the pattern of growth, consumption, and the initial distribution of assets (labour, capital, entrepreneurial talent, technical skills, and globalisation). Empirical and theoretical papers have predicted a range of potential relationships between growth and poverty (Kraay 2006, Ravallion 2012, Lopez and Serven 2009).
Figure 1. No convergence in Income across states in India
Note: Y axis is growth in per capita income for 2000-05.
Source: Government of India, Ministry of Statistics 2008.
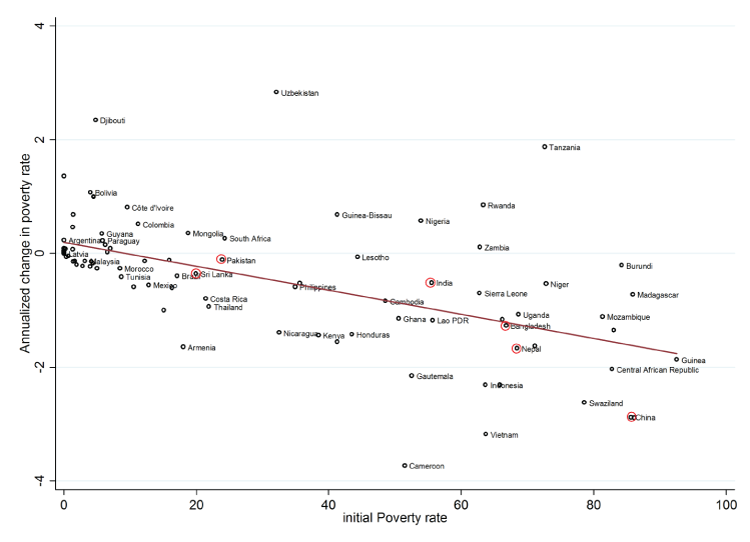
We find that countries with an initially higher level of poverty experience greater absolute reductions in the poverty headcount ratio – the proportion of the population living below the international poverty line on less than $1.25 a day (Figure 2). The y-axis of Figure 2 represents the average annual reduction in the headcount ratio in percentage points.
Figure 2. Convergence in Poverty Head Count Ratios (absolute level)
Notes: Poverty rate is for $1.25 a day poverty rate. Time period for Change in poverty is for 1977-2007. Number of observations is 91.=
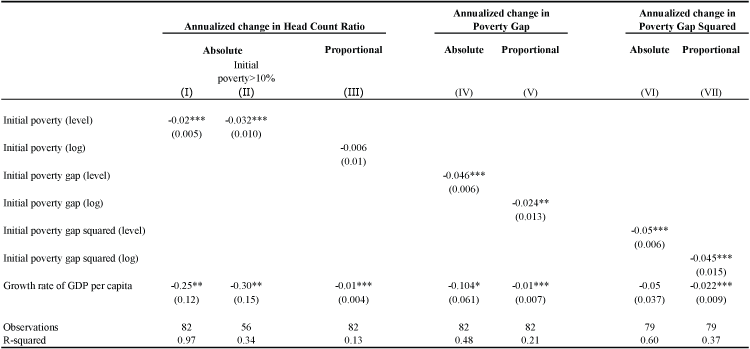
These trends are statistically significant in regressions reported in Table 1, column I. When we regress the absolute change in the headcount ratio on the initial poverty level, we see a negative and statistically significant coefficient, even after controlling for growth rates of per capita GDP.
Table 1. Poverty Convergence Across Countries
Note: Robust standard errors are reported in parenthesis. *** represents significance at 1%, ** represents significance at 5%, * represents significance at 10%. Poverty rate is defined as % of population living in households with consumption or income per person below the international $1.25 poverty line. Annualized poverty change is for time period 1977-2007. Poverty gap is defined as the mean distance below the poverty line as a proportion of the poverty line. Squared poverty gap is defined as mean of the squared distances below the poverty line as a proportion of the poverty line.
Source: Povcalnet, World Bank. 2009 and World Development Indicators, World Bank 2009.
Using the reduction in headcount ratio is obviously an important way to measure economic progress. When comparing across countries, however, we might face two issues with measuring only absolute changes in poverty.
- First, countries with low levels of poverty cannot display high values of poverty reduction. The existence of a ‘floor value’ of zero therefore may not capture all the progress in a country starting from low levels of poverty.
We partially control for the existence of such a floor value by restricting our sample to countries that had a headcount ratio greater than 10% in the initial period. Our results regarding convergence are robust to this restriction (see Table 1, column II). These results provide a basis for cautious optimism regarding progress in poor countries. Poor countries may not be trapped in poverty forever.
- The second caveat to using absolute poverty change is the fact that reducing poverty from a high level might be easier than reducing poverty further from an already low level. The latter might reflect more entrenched factors leading to poverty, including low levels of education or health problems or even persistent beliefs about the value of effort (for example, 12% to 13% of the US population has been under the national poverty line for more than a decade). Using a percentage change in poverty (or equivalently, a change in log poverty) gives a greater magnitude to poverty reductions starting from a low base. It also avoids the ‘floor value’ problem.
When we consider percentage changes in poverty, we do not see any significant degree of convergence in poverty across countries (Table 1, column III). In other words, although poorer countries do reduce absolute numbers of people living in poverty, they do not reduce them proportionally faster than richer countries. This fact has also been documented in Ravallion (2012), who ascribes the lack of convergence to two reasons. The first is that initially poor countries do not grow as fast as not-so-poor countries, and the second is that, for a given rate of growth, poverty reduction in proportional terms appears to be slower in poorer countries.
Convergence in depth and severity of poverty
In addition to the headcount ratio, we examine other measures of poverty, which take into account how far households are from the poverty line. This is particularly important in measuring extreme poverty, which may not be reflected fully in a simple comparison of headcount ratios. The two measures we consider are the Poverty Gap (PG) index and the Squared Poverty Gap (SPG) index – where the poverty gap is the average distance of an individual from the poverty line (with those above having a gap of zero).
Regressions using the PG or SPG measures show strong evidence of convergence across countries, with poorer countries showing the largest reductions in these indices. This holds for absolute reductions as well as proportional ones. This result is encouraging. Even if poorer countries are not able to achieve huge reductions in the headcount ratio, they do appear to show the largest reductions in the depth and severity of poverty (Table 1, columns IV–VII). Although the poorest show the largest increases in consumption, they are so far from the poverty line that this progress does not show up in equivalent changes to the headcount ratio.
Convergence in poverty in India and South Asia
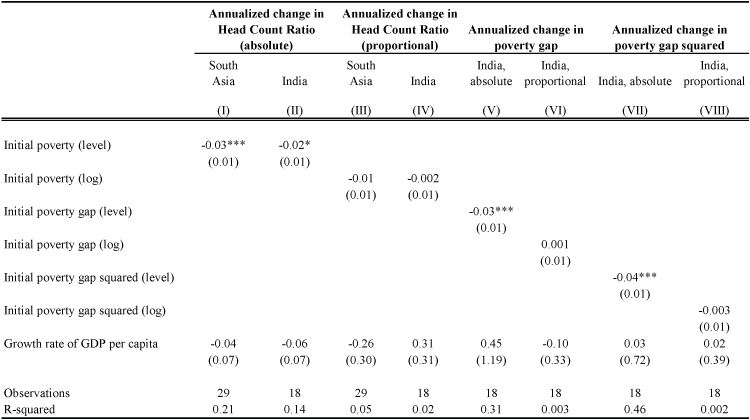
We examine similar trends at the sub-national level within South Asia. The trends within India and across South Asian regions are similar to our earlier results for the global sample. We see that states with higher levels of poverty experienced greater absolute reductions in the headcount ratio (see Table 2, columns I and II). As in the global sample, however, they did not experience greater proportional reductions in the headcount ratio (Table 2, columns III and IV), suggesting that more needs to be done in the lagging regions to align them with the leading ones. When we look at measures of poverty depth and severity, we again see that the initially worse-off regions showed greater improvements in these measures than the initially better-off regions (see Table 2, columns V and VII). Unlike the global sample, the lagging regions in India do not show proportionally better performance in reducing the PG or the SPG measures (Table 2, columns VI and VIII). This is a worrisome sign that poverty reduction in the lagging regions of India and South Asia needs to be accelerated, especially with regard to extreme poverty.
Table 2. Poverty Convergence in India and South Asia
Note: Robust standard errors are reported in parenthesis. *** represents significance at 1%, ** represents significance at 5%, * represents significance at 10%. South Asia includes states in India (1994-2005), Pakistan (1999-2005) and Sri Lanka (1996-2002). * Orrisa is deleted from the sample for India region. * South Asia: Orrisa, Tripura & Northern have been removed.
Source: World Bank staff calculations using the National Sample survey Organization (NSSO) using the 55th and 61st round.
What explains poverty convergence in absolute terms?
Why do we observe convergence in absolute poverty rates, even when we do not observe convergence in per capita incomes or poverty convergence in proportional terms? The poverty measures are based on income or consumption levels derived from household surveys. So, one possibility is that these consumption numbers might be converging even if per capita GDP is diverging. We call this explanation the ‘GDP-consumption disconnect.’ Detailed analysis of Indian household surveys reveals that household consumption grew much slower than overall GDP throughout the 1990s. So this explanation is unlikely to explain the patterns of absolute convergence within South Asia.
Two possible explanations for these patterns are:
- Inequality has fallen a lot in countries that are initially poor.
- The sensitivity of the headcount to the mean is vastly larger in countries that are initially poor.
The inequality channel has little a priori support – most studies find that inequality has risen in fast-growing countries like China and India. The most likely explanation, therefore, is that poverty reduction is much more sensitive to growth in initially poorer countries. Part of this sensitivity is due to the construction of poverty measures – as long as the poorest people increase their consumption levels, we will see sharp reductions in the poverty depth and severity (an increase in consumption among the non-poor does not affect these measures).
If a lot of people live just below the poverty line, a small growth in consumption can move a lot of people above the line, resulting in a large decrease in the headcount ratio. And, in an initially poor country, a lot of people live both just below the poverty line and far below it, compared with those living in an initially not-so-poor country. Consumption growth in the not-so-poor country will affect a smaller proportion of the overall population and thus make a smaller change to the poverty measures.
Conclusions
Our results reflect a partially optimistic picture. We find proportionate reductions in the depth and severity of poverty in the initially poor countries. These countries are not trapped in poverty.
The picture in India and South Asia, however, is less rosy. We do not see proportionate reductions in either the headcount ratio or in the depth and severity measures. Poor regions are not catching up with richer regions fast enough, and more needs to be done to accelerate economic and social development in the lagging regions.
Authors’ note: The views expressed here are those of the authors and not necessarily of the World Bank or any other institution.
References
Ahluwalia, M (2000), “Economic performance of states in the post reforms period”, Economic and Political Weekly, May, 6:1637-1648.
Chen, Shaohua and Martin Ravallion (2008), “The Developing World is Poorer than We Thought, but No Less Successful in the Fight against Poverty”, World Bank Policy Research Working Paper 4703.
Ghani, Ejaz (ed.)(2010), The Poor Half Billion in South Asia—What is holding back lagging regions?, Oxford University Press.
Ghani, Ejaz, L Iyer, and S Mishra (2010), “Are Lagging Regions catching up with leading egions?” in Ghani (ed.), The Poor Half Billion in South Asia—What is holding back lagging regions?, Oxford University Press.
Kraay, Aart (2006), “When is Growth Pro-Poor? Evidence from a Panel of Countries” Journal of Development Economics 80: 198-227.
Kochhar, K, U Kumar, R Rajan, A Subramanian, and I Tokatlidis (2006), “India’s Pattern of Development: What Happened, What Follows?”, Journal of Monetary Economics, 53:981-1019.
Subramanian, A (2011), “India’s Growth in the 2000s: Four Facts”, VoxEU.org, 5 December.
Lopez, Humberto and Luis Serven (2009), “Too Poor to Grow”, World Bank Policy Research Working Paper 5012.
Ravallion, Martin (2012), “Why Don’t We See Poverty Convergence?”, American Economic Review, 102(1): 504-523.
World Bank (2009a), PovcalNet. PovcalNet Online Poverty Analysis Tool. Available publicly here.
World Bank (2009b), World Development Indicators, World Bank.


