In the World Cup (or Mundial in Spanish), the tails matter. Each nation’s destiny depends on the players on the pitch. The question is not which nation has the highest average quality of football players among its population nor which nation has the best single player but which country can assemble a team of 11 at their various positions, who can beat all comers. This depends on central tendency, the right tail, and the absolute size.
Each year there is an International Mathematical Olympiad in which each country can send six contestants who each face an extremely difficult mathematics examination with 42 possible points. Averaged from 2001 to 2007 the world’s mathematics examination champion is China, with an average score per test taker of 35.1, next comes the US at 29.9, followed by Korea at 28. India, with a very low quality of basic education but a long-tail in the distribution of learning achievement (Das and Zajonc 2010) and a massive population, had an average score of its six contestants of 21. Mexico’s average score of its six contestants was 13.3.
Hanushek and Woessmann (2009a) have used internationally comparable data to show that it is educational quality – measured as learning achievement – that appears to matter for growth. In particular, the quality of learning achievement in Latin America seems to explain a significant part of Latin America’s lagging growth prospects (2009b and 2009c on this site). Their research also suggests that it is not just the average quality, but quality at the top that matters as well. Yet so far there has been little focus on the implications of a low average quality for the absolute number of people above a threshold.
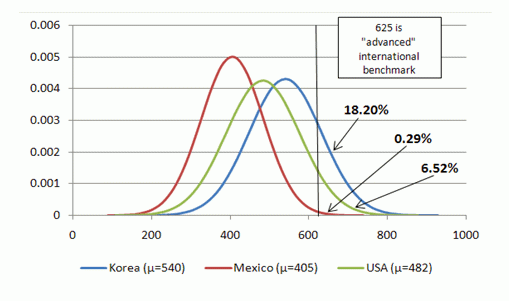
In recent research (Pritchett and Viarengo 2009), we use the Programme for International Student Assessment (PISA) results comparing the knowledge acquired by 15-year-old students to estimate the size of the upper tail. The PISA scores are standardised to an OECD-wide mean equal to 500 and OECD-wide student standard deviation equal to 100. This implies that a score of 625 places a student in the OECD 10% which we take as a minimal global benchmark for “advanced” capability. Figure 1 compares Mexico’s distribution of test scores in mathematics to the US and Korea1. As is widely known, the Mexican average of 405 is significantly below the OECD average of 500, the US average of 482, and very far from the Korean average of 540.
Figure 1. Distribution of test scores in the PISA 2003 Mathematics assessment and fraction above a high benchmark score
But what has been less emphasised is that the low average (without a correspondingly larger inequality into the right tail) implies a very small share of students at the top of the distribution. So, while 18% of Koreans are above this benchmark, and even 6.5% of US 15-year-olds (a group not recognised internationally for mathematical brilliance) only three in every
thousand Mexican students are above that threshold.
This tiny share implies a small absolute number of students above the advanced international benchmark, but to compute this we have to go beyond the PISA results themselves and make some assumptions. The difficulty is that we only have actual information on the tested population which was a random sample of enrolled 15-year-olds. If we assume that no school drop-out would have scored above 625 if tested this gives a lower bound estimate. An alternative assumption is that drop-outs would have had the same likelihood of scoring above 625 as the enrolled, which gives an “upper bound” on the total.
The lower bound estimates are that each year, of a cohort of around 2 million students, Mexico produces only around 3,500 students that would be in the OECD top 10%. Even the certainly over-optimistic upper bound estimate is only 5,822. Every 15-year-old in Mexico that scores above 625 could fit in a small auditorium (Table 1).
Table 1. Estimates of the total number of 15 year olds above an “advanced international benchmark” in mathematics for selected countries
|
|
Cohort Size of 15 year olds
|
Gross Enrollment Rate in Secondary School
|
Estimated number of test takers (15 year olds, enrolled)
|
Test takers per 100 above the "advanced international benchmark" of 625 in Mathematics
|
Estimated absolute number of students above threshold
|
|
Lower bound
|
Upper bound
|
|
|
A
|
B
|
C
|
D
|
C*D
|
A*D
|
|
Mexico
|
2,007,721
|
60
|
1,204,632
|
0.29
|
3,493
|
5,822
|
|
Slovakia
|
85,095
|
75
|
63,821
|
9.42
|
6,012
|
8,016
|
|
Thailand
|
1,021,145
|
71.2
|
727,055
|
1.51
|
10,979
|
15,419
|
|
India
|
21,994,737
|
52.3
|
11,503,247
|
0.83
|
95,659
|
182,904
|
|
Korea
|
701,056
|
97.2
|
681,426
|
18.2
|
124,020
|
127,592
|
|
US
|
4,178,014
|
88
|
3,676,652
|
6.52
|
239,718
|
272,407
|
Note: India has neither PISA nor TIMSS results, but a recent paper was able to estimate this number based on matching TIMSS methods. The percentage is derived backwards from the raw lower bound estimate.
And we should not forget that Mexico is a large country. Das and Zajonc (2010) have used the Trends in International Mathematics and Science Study (TIMSS) results to estimate similar numbers for a variety of countries. Small countries like Chile have only 7,000 in a cohort even above the TIMSS threshold of 550 (TIMSS is scaled similarly to PISA) and the number above 625 rounds to zero. In fact there are a number of developing countries for whom the estimates of the upper tail are essentially zero – including medium-sized countries such as the Philippines, South Africa, and Iran. For countries that are both small and with low average performance and typical variance there are very few students even above 550. So, for all its weaknesses, the US produces a million children a year with mathematics proficiency above 550 and Korea produces half a million (for much smaller population) while at the same standard Morocco produces only 2,000, Tunisia 1,000 and Ghana next to none (Table 2).
Table 2. Estimates of numbers of a cohort above absolute performance thresholds for mathematics using TIMSS data
|
|
Number above threshold on TIMSS (in ‘000), rounded to nearest thousand
|
|
Country
|
Above 550
|
Above 625
|
|
Top three in number above 625
|
|
Japan
|
753
|
291
|
|
US
|
1069
|
258
|
|
Korea
|
452
|
226
|
|
Selected developing countries
|
|
Egypt
|
78
|
13
|
|
Philippines
|
37
|
0
|
|
Iran
|
32
|
0
|
|
South Africa
|
12
|
0
|
|
Chile
|
7
|
0
|
|
Morocco
|
2
|
0
|
|
Tunisia
|
1
|
0
|
|
Ghana
|
0
|
0
|
Source: Adapted from Das and Zajonc (2010), Table 3.
Mathematics in the Olympiad, in the PISA and in the TIMSS is of interest not because anyone regards mathematics as uniquely important but primarily because establishing objective standards of performance is believable. The results for language performance or scientific competence produce similar results (see Pritchett and Viarengo 2009). The consequence of low average quality, combined with typical variances, is that in many poor countries, even middle-income countries, the upper tail of learning achievement is very sparse.
Conclusions
The economic implications of this death of global “superstars” (or even stars) are yet to be explored but there are several ways in which this may be important. First, it is clear that in the US labour market the demand for skills is increasing and increasing faster in the upper tails than in the middle. Second, in models of economic growth in which agglomeration economies in R&D or innovation play a role the typical measures of enrolment or schooling completion are massively underestimating the differences in available research quality human capital. Third, more generally, in models in which entrepreneurship, innovation, adaptation and invention play a role in global convergence, the absolute level of talent, skill, and capability may be an important factor.
We are obviously not suggesting that international competition has the “winner-take-all” nature of sports. But, if the absolute number of upper tail capability plays any role in countries' economic performance then this is particularly problematic, especially since the dominant policy attention and rhetoric in developing countries are completely focused elsewhere – on expanding enrolments, increasing inputs, and, where quality is raised at all, more concerned with remediation of the lower tail. None of these are going to be at all useful if what is needed are superstars in the economic Mundial.
References
Das J and T Zajonc (2010), “India Shining and Bharat Drowning: Comparing Two Indian States to the Worldwide Distribution in Mathematics Achievement”, Journal of Development Economics, 92(2):175-187.
Hanushek, Eric A and Ludger Woessmann (2009a), "Do better schools lead to more growth?", NBER WP 14633, National Bureau of Economic Research, January.
Hanushek, Eric A, and Ludger Woessmann. (2009b), "Schooling, cognitive skills, and the Latin American growth puzzle." NBER Working Paper 15066, June.
Hanushek, Eric A and Ludger Woessmann (2009c), “Poor student learning explains the Latin American growth puzzle”, VoxEU.org, 14 August.
Pritchett L and M Viarengo (2009), “Producing superstars for the economic Mundial: The Mexican predicament with quality of education”, in R Hausmann, E Austin and I Mia (eds), Mexico Competitiveness Report 2009, World Economic Forum, Geneva.
1 We show here the figure for mathematics only as it appears to be the most readily comparable subject across countries. Analogous figures for science, reading and problem solving are available from the authors upon request.


