Even before the 2008 Global Crisis, productivity growth had slowed in many OECD countries. This ignited a spirited debate on the future of productivity. So far, this debate has largely been conducted from a macroeconomic perspective. It has paid attention to prospects for innovation at the global productivity frontier (e.g. Gordon 2012 versus Brynjolfsson and McAfee 2011), the role of secular stagnation (Summers 2016), and even mismeasurement (Byrne et al. 2016). But analyses based on aggregate data ignore the complexity that characterises contemporary economies, particularly the heterogeneity in firm productivity that exists within narrowly defined sectors (Syverson 2004).
In fact, productivity growth at the aggregate level is the result of two underlying microeconomic forces (Foster et al. 2001) which we will call micro-drivers 1 and 2:
- Heterogeneous productivity growth performance within firms;
- The processes of creative destruction and resource reallocation whereby new firms enter the market and replace old ones, and scarce resources are continuously reallocated towards more productive activities.
In this context, in new OECD research we argue that the global productivity slowdown at the aggregate level masks a deterioration in both micro-drivers (Andrews et al. 2016). By distinguishing between firms at the global productivity frontier and laggards, we find a noticeable decline over time in both the pace of laggard firm’s catch-up to the global productivity frontier (micro-driver 1) and the extent of market dynamism and growth-enhancing reallocation (micro-driver 2). These sources of productivity weakness can, in turn, be linked to the slowdown in the pace of structural reforms in product markets.
Using a harmonised cross-country firm-level database for 24 countries, we define global frontier firms as the top 5% of firms in terms of labour productivity levels, within each two-digit sector, in each year, across all countries since the early 2000s. All other firms are defined as laggards. Between 2001 and 2013, labour productivity at the global frontier increased at an average annual rate of 2.8% in the manufacturing sector, compared to productivity gains of just 0.6% for laggards. This divergence was even more pronounced in business services (Figure 1). From this perspective, the productivity slowdown is not so much a slowdown of productivity growth at the global frontier, as techno-pessimist accounts (Gordon 2012) would imply. The striking feature of slow aggregate productivity growth is that a small cadre of frontier firms are experiencing robust gains, masking an increasing productivity gap between the global frontier and laggard firms.
Repeating this exercise using multi-factor productivity (MFP) estimates suggests that this productivity divergence remains after we controlled for differences in capital deepening and the ability of frontier firms to charge higher mark-ups. We conclude that the rising MFP gap between global frontier and laggard firms may reflect divergence in productivity or technology, broadly defined.
Figure 1 A widening labour productivity gap between global frontier firms and other firms (value added per worker)
a. Manufacturing
b. Business services
Notes: The global frontier is measured by the average of log labour productivity for the top 5% of companies with the highest productivity levels within each 2-digit industry. Laggards capture the average log productivity of all the other firms. Unweighted averages across 2-digit industries are shown for manufacturing and services, normalised to 0 in the starting year. The vertical axes represent log differences from the starting year: for instance, the frontier in manufacturing has a value of about 0.3 in the final year, which corresponds to approximately 30% higher in productivity in 2013 compared to 2001. Services refer to non-financial business sector services.
Source: Andrews et al. (2016).
What could explain this divergence?
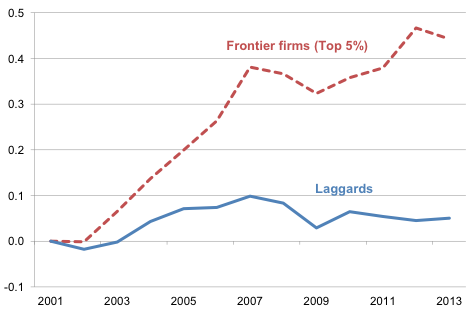
One explanation is that the increasing potential of digital technologies to create global winner-takes-all dynamics (Brynjolfsson and McAfee 2011) has helped frontier firms to increase their performance gap against laggards. In support, we find two distinct patterns in ICT services (computer programming, software engineering, data storage, and so on), an industry in which winner-takes-all patterns should be more evident than in other sectors. First, global frontier firms increased their market share. Second, MFP divergence was more pronounced, both between frontier and laggard firms and within the global frontier, where the productivity of the most elite firms (top 2%) rose relative to top 5% frontier firms (Figure 2).
All else equal, these patterns are not necessarily a policy concern. They could simply imply higher aggregate productivity growth. Yet, we find the opposite: aggregate MFP performance was significantly weaker in industries where MFP divergence was more pronounced, implying that the divergence was not solely driven by frontier firms pushing the boundary outward plus more efficient resource allocation. This suggests that obstacles to the productivity growth of laggards have increased, slowing aggregate productivity growth.
This leads us to explore stalling technological diffusion and market dynamism among laggards, which is the second source of MFP divergence and aggregate productivity slowdown. On one hand, this stagnation could naturally reflect the increasing costs for laggard firms of moving from an economy based on production to one based on ideas. For example, laggard firms may lack the required capabilities, if technological advances had increased the amount and sophistication of complementary intangible investments (for example managerial quality) that are necessary for technological adoption. A possible symptom of this is that it has become less likely that laggard firms outside the top quintile of the productivity distribution subsequently enter the global productivity frontier, particularly in services where intangibles and tacit knowledge are important.
Figure 2 The role of winner-takes-all dynamics: Frontier productivity is especially strong among ICT services
a. Information and communication services
b. All other business services
Notes: In Panels A and B, the global frontier group of firms is defined by the top 5% of companies with the highest MFPR levels within each 2-digit industry, while laggards capture all the other firms. Unweighted averages across 2-digit industries are shown for sales and MFPR, separately for services and ICT services, normalized to 0 in the starting year. Services refer to non-financial business services.
Source: Andrews et al. (2016).
On the other hand, indicators of market dynamism could reflect the declining incentives of laggard firms to adopt the latest technologies and business practices. First, we document the increasing survival of marginal (or loss-making) incumbent firms that would typically have exited in a competitive market (Figure 3A), despite a deterioration in their relative productivity (Figure 3B). It has become relatively easier for weak firms that do not adopt best practices to survive. Second, the adverse effects on aggregate technology adoption are reinforced by the decline in entry, which implies less indirect pressure on incumbent firms to improve their productivity (Bartelsman et al. 2004).
These patterns – which are consistent with a broader decline in the contestability of markets and growth-enhancing reallocation – lead us to explore the link between MFP divergence and product market reforms. There is still scope for policy to boost growth by promoting market competition, especially in services which are generally more sheltered from international markets. This would also create better conditions for growth-enhancing reallocation through the entry of more productive businesses and the exit of less successful ones, which would sharpen the incentives for technological adoption.
Figure 3 Indicators of declining market dynamism amongst laggard firms
a. Share of total firms
b. MFPR relative to viable firms
Notes: The figure shows the frequency and relative productivity of three groups of firms: firms aged 5 years or less (young firms), firms aged 6 to 10 years (mature firms) and firms older than 10 years that record negative profits over at least two consecutive years (non-viable old firms). The omitted group are firms older than 10 years that do not record negative profits over at least two consecutive years (viable old firms). The age of the firm is inferred from the incorporation date. The estimates are unweighted averages across industries in the non-farm non-financial business sector.
Source: Andrews et al. (2016).
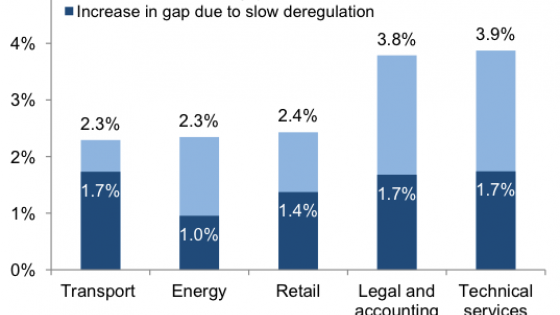
Cross-country econometric analysis at the industry level shows that the rise in productivity divergence between the best firms and the rest is much more extreme in sectors where pro-competition market reforms were slowest. Had the pace of product market reforms in retail trade and professional services – in which market regulations remained relatively stringent in OECD countries – been equivalent to that experienced by telecommunications – where reforms were most extensive – then the average increase in the MFP gap may have been as much as 50% lower than the gap we observed (Figure 4).
Figure 4 The role of policy: Productivity of laggards could be lifted by reforms in product market regulation
Contribution to the annual change in the MFP gap of the slower pace of reform relative to the best practice industry
Notes: The figure shows the annual change in the MFPR gap between the frontier and laggard firms, and the part that is explained by slower deregulation than that observed in the fastest deregulating industry (telecom), based on the coefficient estimates in Column 2 of Table 2, Panel A. The estimates are averaged over countries and years. Growth rates expressed in percentages are approximated by log-point differences.
Source: Andrews et al. (2016).
In sum, while structural changes in the global economy meant that technological diffusion became more difficult for the typical firm during the 2000s, these difficulties – and the aggregate productivity slowdown more broadly – were compounded by the failure of policy to encourage the diffusion of best practices in OECD countries.
References
Andrews, D, C Criscuolo, and P N Gal, (2016) "The Best versus the Rest: The Global Productivity Slowdown, Divergence across Firms and the Role of Public Policy", OECD Productivity Working Papers No. 5, OECD Publishing, Paris.
Bartelsman, E, J Haltiwanger and S Scarpetta (2004) “Microeconomic evidence of creative destruction in industrial and developing countries” Policy Research Working PaperSeries 3464, The World Bank, December 2004.
Brynjolfsson, E, and A McAfee (2011), Race Against The Machine: How the Digital Revolution is Accelerating Innovation, Driving Productivity, and Irreversibly Transforming Employment and the Economy, Digital Frontier Press.
Byrne, D, J Fernald and M Reinsdorf (2016), “Does the United States have a productivity slowdown or a measurement problem?” Brookings Papers on Economic Activity Conference Draft, March 10-11 2016
Foster, L, J Haltiwanger and C J Krizan (2001),"Aggregate Productivity Growth: Lessons from Microeconomic Evidence," in New Developments in Productivity Analysis, University of Chicago Press, pages 303-372.
Gordon, R (2012), “Is US Economic Growth Over? Faltering Innovation Confronts the Six Headwinds”, NBER Working Papers, No. 18315.
Summers, L (2016), “The Age of Secular Stagnation: What It Is and What to Do About It,” Foreign Affairs March/April issue.
Syverson, C (2004), "Product Substitutability and Productivity Dispersion," Review of Economics and Statistics, May.


