A growing literature uses sub-national data from China to measure trends in regional inequality and to test models of economic growth and convergence. Most published studies use provincial-level data although finer spatial scales, such as prefectures (Roberts et al. 2012) and counties (Banerjee et al. 2012), are starting to be used. But regardless of scale, most authors ignore that China’s local GDP per capita data cannot be interpreted in the way that economists would expect, of measuring value-added or output per resident. Instead, for most of the reform era in China, what has been reported is the GDP per registered population.
Unlike in most countries, China’s local populations can be counted in two ways; by how many people have hukou household registration from each place and by how many people actually reside in each place. The counts differ by the non-hukou migrants – people that move from their place of registration – who have grown from fewer than five million when reform began in 1978 to over 200 million by 2010. For most of the first three decades of the reform era, the hukou count was used to produce per capita GDP figures. In coastal provinces the hukou count is many millions more than the resident count, while for migrant-sending inland provinces it is the reverse, creating a systematic and time-varying error in provincial GDP per capita.
For example, at the time of the 2000 census, Guangdong province had a registered population of 75 million but residents numbered 86 million, so the hukou count overstates GDP per capita by 15%. At finer spatial scales, such as for individual counties and cities, the error is much larger. The city of Shenzhen provides an extreme example; its registered population was just over one million by the time of the 2000 census but its residents numbered seven million, so per capita GDP was overstated by almost 600% in the official data of the time (Chan 2009).
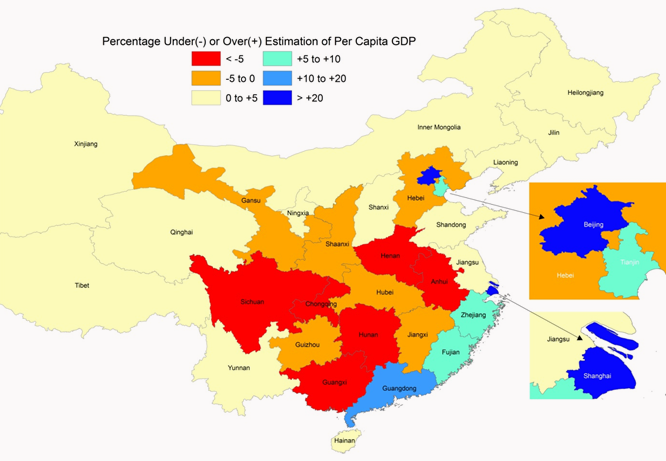
The patterns of over- and under-statement from using the hukou count as of 2005 are shown in Figure 1. This year is chosen because prior to 2011 correct resident counts for each province only come from the decadal Census and the inter-decadal micro-census. Annual reports of resident population in Statistical Yearbooks miscount in-coming and out-going non-hukou migrants, and these errors continue to plague sub-provincial estimates even after 2011.
For the six provinces in the central interior of China with the largest understatement, on average GDP per capita was 7% lower using registered rather than resident population. Six adjacent (but still interior) provinces also had GDP per capita understated, while 13 provinces around the western, northern, and northeastern periphery have no bias since they are neither important sources nor destinations for non-hukou migrants. The final six provinces are all main destinations for non-hukou migrants, with per capita GDP overstated by an average of 15%. This includes provinces on the southeast coast (Shanghai, Zhejiang, Fujian, and Guangdong) and the Beijing-Tianjin conurbation. In terms of growth rates, wrongly using GDP per registered population overstates 1990-2010 trend growth rates for Beijing and Shanghai by about two percentage points per year.
Figure 1. Percentage difference in GDP per registered and per resident population: 2005
In addition to using the wrong denominator, another problem is the sharp discontinuity created when provinces recently switched from the hukou count to the resident count for reporting GDP per capita. Also, a double-count resulted because some provinces switched early (18 years between the first and last province switching). Hence, someone may be in the denominator of GDP per capita for two different places at the same time; as a resident of one province and in the registered population of a province that was slow to switch to reporting output per resident – up to 26 million people were double-counted.
In a recent working paper (Li and Gibson 2012) my co-author Chao Li and I describe these errors in the provincial population data for China. We also show their impact on measured inequality in provincial GDP per capita. The apparent rise in inequality, and change in trend around 2003, is a statistical artefact resulting from the unusual way that China’s local GDP has been denominated. Both matter because public debate is coloured by a perception of rising regional inequality during the reform era, when the opposite is true. The spurious trend change matters because it coincides with initiatives to reduce regional inequality that saw more than one trillion yuan ($180 billion) invested into infrastructure development in the western provinces. This may have been socially productive but evaluating its impact on inequality is difficult because of the measurement error caused by changing population denominators.
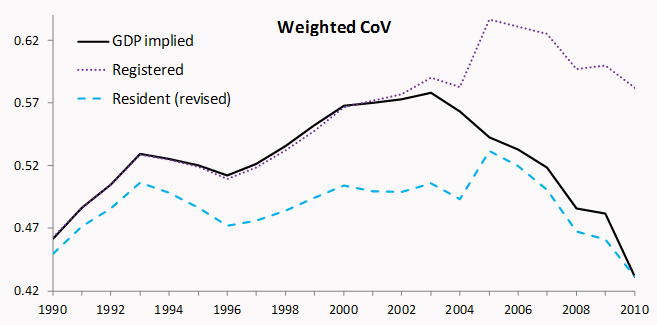
Figure 2 uses the population-weighted coefficient of variation to show the effect of these errors on trends in inter-provincial inequality (the Gini coefficient and Theil index show the same trends). Three population denominators are used: the one implied by the published Statistical Yearbook data on GDP per capita, the hukou count, and the revised resident count available since 2011 and backdated to 1990.
Figure 2. Inter-provincial inequality in GDP per capita with various population denominators
Inequality in reported GDP per capita (the solid line) rose rapidly in the decade from 1990 (at a 2% annual rate). This greatly exceeds the trend if GDP per capita is calculated using the revised resident population estimates (the dashed line); the rise by year 2000 is 94% higher than with the revised data. If the basis of GDP per capita calculations had not changed, the apparent inter-provincial inequality would have continued rising sharply (shown by the dotted line). But, in fact, inter-provincial inequality returns almost exactly to its starting point by 2010 in the time series based on the revised data. Thus, without the switch away from the hukou count in the official data, all of the apparent rise in inequality would have been measurement error.
The apparent change in trend in 2003, when using the GDP implied population series, is an artefact resulting from the switch to reporting per capita GDP on a resident basis. Since inequality in GDP per resident is much lower than inequality in GDP per registered population, this switch in statistical procedure mechanically reduces measured inequality in the officially reported GDP per capita without any underlying change necessarily occurring in the economy.
Putting the corrected data for the last two decades into the context of the entire reform era, the changing pattern of inter-provincial inequality has four episodes, only one of which involves rising inequality. From 1978 until 1990 inter-provincial inequality declined almost continuously; about one-third of this decline was reversed over the next three years; then a decade of little change in inequality was ended by a one-year rise in 2005 but even with that rise, inequality had returned to only two-thirds of its starting value in 1978; finally, inter-provincial inequality fell sharply after 2005, so that by 2010 it was right back at the low levels previously seen in 1990. Thus the only sustained episode of rising inequality in the reform era was from 1990 to 1993, representing just three out of 33 years since liberalisation began.
References
Banerjee, A, E Duflo, and N Qian (2012), “On The Road: Access to Transportation Infrastructure And Economic Growth In China”, Working Paper No. 17897, National Bureau of Economic Research.
Chan, KW (2009), “Measuring the Urban Millions”, China Economic Quarterly, March, 21-26.
Li, C and J Gibson (2012), “Rising Regional Inequality in China: Fact or Artefact?", Working Paper, No. 09/12, Department of Economics, University of Waikato.
Roberts, M, U Deichmann, B Fingleton, and T Shi (2012), "Evaluating China's Road to Prosperity: A New Economic Geography Approach", Regional Science and Urban Economics 42(4):580-594.


