According to the growth literature, GDP per capita growth and convergence are influenced by institutions, education, and of course innovation and technological progress, which are themselves linked to education and institutions (for a large synthesis, see Aghion and Howitt 2009).
Growth decline from huge TFP slowdown
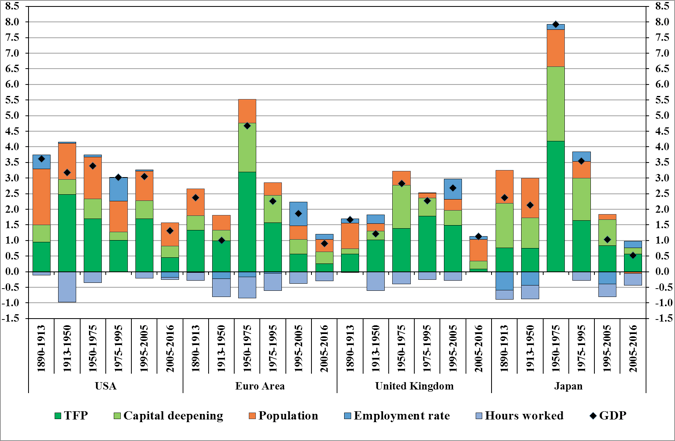
To highlight the recent decline in productivity, we have constructed a new database to break down GDP growth into its usual main components, and to estimate the role of total factor productivity (TFP) since the end of the 19th century in various countries (Bergeaud et al. 2017).1 Figure 1 shows the result of this decomposition over different sub-periods of 1890-2016 for the four main developed areas: the US, the Eurozone (EA), the UK and Japan (JP). The accounting decomposition of GDP growth is based on a simple Cobb-Douglas production function. The three main components of GDP growth are population growth, the growth in the number of hours worked per inhabitant, and hourly labour productivity growth. The contribution of the number of hours worked per inhabitant is itself decomposed into two sub-components: the employment rate and the number of hours worked per worker. The sum of the population and average working time per worker components corresponds to the overall contribution of the total number of hours worked to growth. The contribution of hourly labour productivity growth is itself decomposed into two sub-components: TFP and capital deepening.
Figure 1 GDP annual growth (%) and contributions (percentage points), whole economy
Source: Bergeaud et al. (2016a)
Hourly labour productivity growth appears to be the main contributor to GDP growth in the four economic areas considered. The overall contribution of hours worked is generally small, if not null. Within hourly labour productivity growth, the contribution of the TFP sub-component is the largest, with that of capital deepening being smaller. This TFP contribution varies a lot from one sub-period to another, with these variations generally being the main driver of changes in GDP growth.
Taking this long-run view makes it clear that GDP growth appears particularly low since 2005 in all four economic areas. The main accounting origin of this low growth is a declining contribution from TFP. Are we therefore facing a risk of ‘secular stagnation’ in the sense that there is not much TFP gain to be expected in the future? To go further into this question, we take a deeper look at TFP developments.
The TFP slowdown
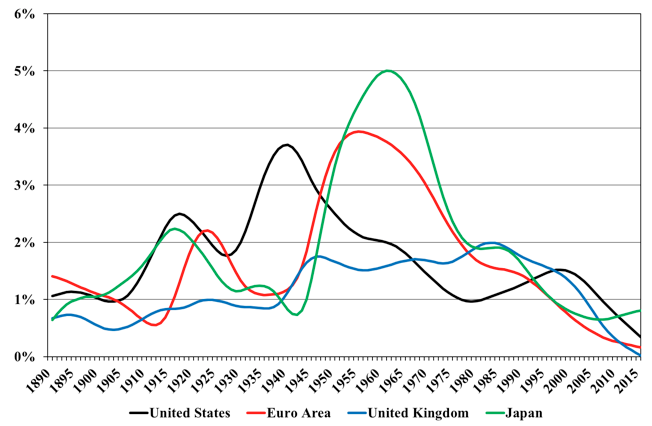
Figure 2 shows the long-term trends of TFP growth, from 1890 to 2016. We mainly distinguish five sub-periods.
- From 1890 to WWI, productivity grew moderately. Developed countries were at the end of the very long first industrial revolution linked to the spread of the steam engine, the development of railways, etc.
Figure 2 Average annual growth rate of TFP (%), smoothed indicator (HP filter, λ = 500), whole economy
Source: Bergeaud et al. (2016a)
- After the WWI slump, the US experienced an impressive ‘big wave’ of productivity growth, interrupted for some years during the Great Depression and identified by Gordon (1999) as the ‘one big wave’, while other countries struggled with the legacy of the Great Depression and WWII. This productivity growth wave corresponds to the second industrial revolution (Gordon 2015) linked to the spread of large-scale use of electricity and the internal combustion engine, to developments in chemistry (namely, oil-based chemistry and pharmaceuticals), and to the development of communication and information innovations (telephone, radio, cinema, etc.). These new technologies translated into productivity gains because they were concomitant with the increasing education level of the population.
- After WWII, European countries and Japan benefited from the big wave experienced earlier in the US. During this catch-up process, TFP growth was already declining in the US. This TFP slowdown appeared later, from the 1970s onwards, in the Eurozone, the UK, and Japan.
- From 1995, a second productivity wave appeared in the US and, in a less explicit way, in some of the other advanced countries. This productivity growth wave corresponds to the third industrial revolution linked to information and communication technologies.
- From the mid-2000s, TFP growth decreased in all countries. This slowdown started before the beginning of the Great Recession. The current pace of TFP growth appears very low compared to what was observed previously, in times of peace. Some analyses regard it as structural (e.g. Gordon 2015) and others as a short pause before a new acceleration linked to the new digital economy (e.g. Brynjolfsson and McAfee 2014, Mokyr et al. 2015, van Ark 2016, Branstetter and Sichel 2017).
Many reasons have been put forward for this slowdown. Among them, recent analyses carried out by the OECD at the firm level suggest that this slowdown is not observed for the most productive firms – in other words, those at the productivity frontier (Andrews et al. 2015) – and would result from a diffusion problem of the best performances from the frontier to the laggard firms. Focusing on French firms, Cette et al. (2017) confirm the OECD results and suggest that the cleansing mechanisms may indeed have become weaker and weaker, possibly because of the decline in real interest rates and the resulting cheaper capital, which allow low-productivity firms to survive and highly productive firms to thrive. Less expensive capital lowers the return on capital expected by firms and allows innovative firms to take on more risks. Recent papers have already confirmed that such an explanation seems relevant for Southern European countries such as Portugal, Italy, and Spain (e.g. Cette et al. 2016).
Nevertheless, the causes of the TFP slowdown are still being debated and consensus is lacking. When estimating the contribution of technology and education to TFP growth, the slowdown hinges mostly on the unexplained share of TFP growth (Bergeaud et al. 2016b). For this reason, contrasting scenarios present as credible for the long-term future of productivity and GDP growth.
Two contrasted growth scenarios for the 21st century
Since there is no convergence on the cause of the productivity slowdown, many scenarios can be constructed for the future. Here, we propose one simple exercise and build two very different growth scenarios to illustrate by how much possible long-term future outlooks can differ. The tool used for this and the hypotheses are detailed in Cette et al. (2017) and available on www.longtermproductivity.com.
In the first scenario, termed ‘secular stagnation’, US TFP growth stays indefinitely at the low level observed both before (1974-1990) and after (2005-2014) the information technology productivity growth wave. In the second scenario, called ‘technology shock’, the US enjoys another large productivity growth wave associated with the new digital economy, as anticipated by van Ark (2016) or Branstetter and Sichel (2017). The underlying TFP growth is then assumed to return to the level observed during the 1990-2005 sub-period. We add to this trend a technology shock lasting over four decades and equivalent to the TFP contribution of electricity during the second industrial revolution in the 20th century, as estimated in Bergeaud et al. (2016b).
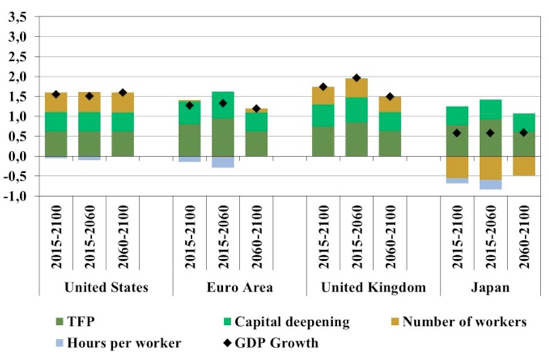
In the secular stagnation scenario, over the period 2015-2100, US GDP growth averages 1.5% (see Figure 3), with a contribution of 1.1 percentage points from labour productivity per hour, decomposed into 0.6pp from TFP and 0.5pp from capital intensity. In non-US areas, average GDP growth is below 1.5% in the Eurozone and as low as 1% in Japan – below US average growth because of low employment growth. In the UK, due to higher employment growth, average GDP growth would be slightly above the US. This secular stagnation scenario corresponds to low future GDP and productivity growth in developed countries. It means that the different headwinds identified by Gordon (2015) will be challenging to face. This scenario would be alarming, leading to risks of social and possibly political instability. It is, however, not a worst-case scenario, as would happen if nothing were done to control global warming.
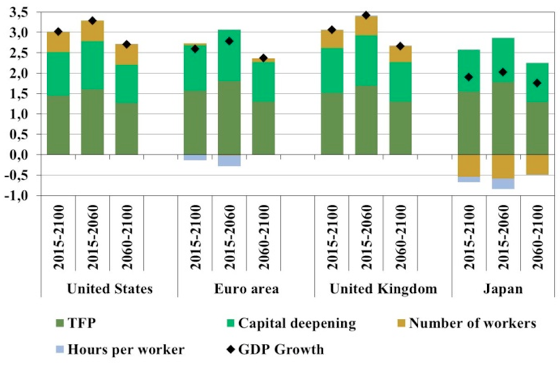
In the technological shock scenario, the yearly US GDP growth rate accelerates to 3% over the 2015-2100 period, with a contribution of 2.5pp from labour productivity, decomposed into 1.4pp contribution from TFP and 1.1pp from capital intensity. Thus, the contributions from TFP and capital intensity are more than double those in the secular stagnation scenario. Over the whole 2015-2100 period, the GDP growth rate would come out at a yearly average of 2.5% in the Eurozone, 3.0% in the UK, and 1.9% in Japan. This pace would correspond to the 1974-1990 trend growth rate for the Eurozone, and the 1950-1974 rate for the UK, but would remain much lower than any 20th century trend growth rate for Japan, as the overall contribution of labour would be negative. In this scenario, there is no doubt that the different headwinds set out by Gordon (2015) would be easy to face, in the US and also in non-US countries.
Figure 3 Average yearly GDP growth and contributions under the ‘secular stagnation’ (top panel) and the ‘technology shock’ (bottom panel) scenarios
Note: The contribution of ‘number of workers’ corresponds here to the sum of the contributions of ‘Population’ and ‘Employment rate’ in Figure 1.
Source: Based on Cette et al. (2017).
The large contrast between these two extreme scenarios illustrates the wide range of possible average GDP growth rates, out to the end of this century. Policies may influence TFP and GDP per capita growth. The challenge in the coming years for the four economic areas will be to not miss the opportunities arising from a possible new TFP growth wave linked to a technology shock which is starting to appear.
References
Aghion, P and P Howitt (2009), The economics of growth, Cambridge, MA: MIT Press.
Andrews, D, C Criscuolo and P Gal (2015), “Frontier firms, technology diffusion and public policy: Micro evidence from OECD countries”, OECD Global Productivity Forum background paper.
Bergeaud, A, G Cette and R Lecat (2016a), “Productivity trends from 1890 to 2012 in advanced countries”, The Review of Income and Wealth 62(3): 420-444.
Bergeaud, A, G Cette and R Lecat (2016b), "The role of production factor quality and technology diffusion in 20th century productivity growth", Cliometrica (forthcoming).
Bergeaud, A, G Cette and R Lecat (2017), “Total factor productivity in advanced countries: A long term perspective”, International Productivity Monitor 32: 6-24.
Branstetter, L and D Sichel (2017), "The case for an American productivity revival", Peterson Institute for International Economics, Policy Brief, Number 17-26, June.
Brynjolfsson, E and A Mcafee (2014), The second machine age: Work, progress, and prosperity in a time of brilliant technologies, Kindle edition.
Cette, G, S Corde and R Lecat (2017), “Stagnation de la productivité en France : heritage de la crise ou ralentissement structurel ?”, Economie et Statistique, Forthcoming.
Cette, G, J Fernald and B Mojon (2016), “The pre-Great Recession slowdown in productivity”, European Economic Review, 88: 3-20.
Cette, G, R Lecat and C Marin (2017), “Long-term growth and productivity projections in advanced countries”, OECD Journal: Economic Studies 2016/1: 71-90.
Gordon, R (1999), “US economic growth since 1970: One big wave?”, American Economic Review 89(2): 123-128.
Gordon, R (2015), “Secular stagnation: A supply-side view”, American Economic Review, Papers & Proceedings 105(5): 54-59.
Hansen, A (1939), “Economic progress and declining population growth”, American Economic Review 29(1): 1-39.
Mokyr, J, C Vickers and N L Ziebarth (2015), “The history of technological anxiety and the future of economic growth: Is this time different?”, Journal of Economic Perspective, 29(3): 31-50.
L (2015), “Demand side secular stagnation”, American Economic Review, Papers & Proceedings 105(5): 60-65.
Van Ark, B (2016), “The productivity paradox of the new digital economy”, International Productivity Monitor 31: 3-18.
Endnotes
[1] The construction of the data is described in Bergeaud et al. (2016a). The current version (August 2017) counts 23 countries. Most of the data are available on www.longtermproductivity.com. The Eurozone is here the aggregation of Germany, France, Italy, Spain, the Netherlands, Belgium, Austria, Portugal and Finland, which represent more than 93% of the Eurozone's 2010 GDP.


