The world is rapidly becoming urban. The World Development Report (2009) documents that, by the year 2050, the urban population of regions like Asia is expected to increase by about 400 million in the next two decades. Similarly, 250 million people are predicted to live in Sub-Saharan Africa’s urban agglomerations by 2025. This raises two questions:
- Where will these massive inflows of population locate?
- Will they mostly move to the currently largest cities of each region (Tokyo, Jakarta, Mumbai, Manila, and Cairo) or, on the contrary will they be evenly spread across medium- and small-sized cities?
Today, most economic activity takes place in urban agglomerations, so answering the above questions is of major importance for developing countries. Moreover, understanding how population migrates across cities and countries is also relevant for economically advanced regions like the EU. Where will the citizens of future EU members locate once their countries are admitted to the union? How might the incorporation of a huge country like Turkey, with its population or around 75 million, alter the shape of European cities?
The existing literature on city growth has mainly focused on short periods of time (Glaeser et al. 1995, Henderson and Wang 2007) or on the experience of one or two countries only (Eaton and Eckstein 1997, Ioannides and Overman 2003). In recent research (Cuberes 2010), I shed light on the questions raised above by studying a longer period of time and a large set of countries, and crucially using both data on administratively defined cities and metropolitan areas. The latter are often much larger entities but both units of analysis have been used in the literature, mostly depending on the specific research question.
The first new fact I uncover is that, in most decades and countries, a few cities grow much faster than the rest. The most direct way to illustrate this is to calculate the coefficient of skewness for each country-decade cross-section of city growth rates. A positive (negative) skewness indicates a distribution with an asymmetric tail extending toward more positive (negative) values. In 88% of my sample of cities, the coefficient of skewness is positive. I next run a normality test that reveals that in 78% of the cases these coefficients are statistically different from zero. For metropolitan areas, 77% of the cross-sections are skewed to the right. When I run the test described above, 60% of the observations reject that metropolitan area growth rates distributed normally. These percentages are remarkably high, given the fact that the number of cities/metropolitan areas is quite small in many periods and countries.
Next, I expand the previous finding and investigate from what part of the city size distribution the fastest-growing cities come in each decade. I begin by ranking each country’s cities by size – in terms of population – at every decade, with the largest city having rank 1, the second largest having rank 2, and so on. Next, for each country-decade, I calculate the 75th percentile of cities’ growth rates and consider the cities whose growth rate is larger or equal to this threshold. I refer to these cities as “fast-growers” in that decade, and I calculate their average rank. In particular, I attempt to answer two questions:
- First, for a given decade, do the large cities (low rank) or the small ones (high rank) grow the fastest?
- Second, does this pattern change from decade to decade?
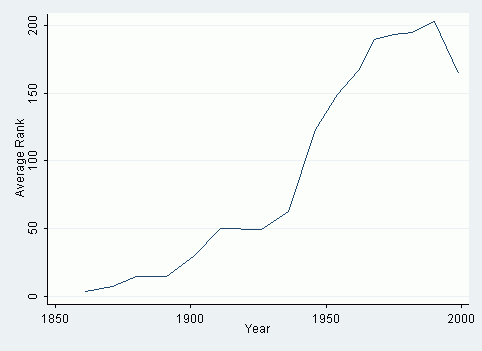
Figure 1 displays the evolution of the rank of the fastest growing cities in France for the period 1861-1999. Early on in the process of urbanisation, the largest French cities grow fastest (the average rank of these cities is 3.5 in 1861). As time passes, population growth in the larger cities declines and the fastest population growth can be found in smaller cities farther down in the urban hierarchy (an average rank of 62.6 in 1936 and 164.5 by the end of the period). This is consistent with the theories of sequential city growth (Henderson and Venables 2009, Cuberes 2009) that argue that the tension between increasing returns and congestion costs provide an advantage to the initially large cities. Eventually though, the medium and small cities are the ones that attract most of the new population.
Figure 1. The evolution of the average rank of the fastest-growing cities in France
To test this prediction in a systematic way I run a panel regression of the average rank of the 25th fastest-growing cities (RANK25) of a country against time. The regression includes country fixed effects to account for unobservable country time-invariant factors that could affect the evolution of RANK25 over time. Examples of such unobservable variables are aspects of geography and culture that may have an impact on a country’s city growth process.
The coefficient associated with time is large and positive, indicating that cities tend to grow in sequential order. However, this positive time trend may in part be driven by the fact that the number of observations in the sample increases substantially as time goes by. This happens mostly due to the fact that data availability in the early nineteenth century is much sparser than in the post World War II era. The increasing number of observations as time goes by implies that it is more likely that, in a random draw, one city has a high rank. To account for this, I control for the number of cities/metropolitan areas without missing data on population in the regression described above. After controlling for this margin, the associated time coefficient is smaller but still positive and statistically significant, indicating that data availability is not driving the result1.
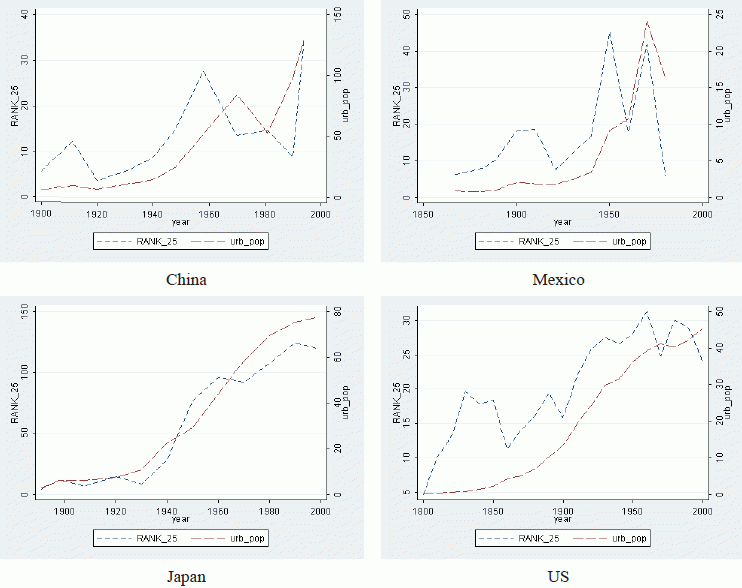
Finally, the third new fact is that the sequential growth pattern described above is more pronounced in decades where a country’s urban population grows faster than usual. This is a prediction of the theories of sequential city growth; a rapid increase in the urban population of a country puts more pressure on the existing cities which then reach their critical size faster. When I regress the growth rate of RANK25 on the growth rate of the urban population, the coefficient is clearly positive, even after controlling for the increase in the number of observations in my sample. Figure 2 plots the evolution of RANK25 and the urban population in four countries. Consistent with the previous regression results, it is apparent that the two lines display a strong positive correlation in these examples2.
The three results presented in this paper are robust to the cut-off that determines the sample selection, and to the definition of what constitutes a “fast-growing” city. Moreover, the study also shows that there are some remarkable differences in this city growth pattern across world regions.
Figure 2. RANK25 and urban population in different countries
Conclusion
The three new findings described in this paper represent a significant deviation from the predictions of standard random growth theories. This very robust pattern across countries that greatly differ in their geographic and socioeconomic environments provides strong support for the recently proposed theories of sequential city growth. Moreover, these stylised facts are valuable inputs for policymakers, especially in countries that are urbanising rapidly.
References
Cuberes (2010) “Sequential city growth: empirical evidence” Instituto Valenciano de Investigaciones Económicas Working Paper 2010-05.
Cuberes, David (2009), “A Model of Sequential City Growth”, The BE Journal of Macroeconomics, 9,1 (Contributions), Article 18.
Eaton, Jonathan, and Zvi Eckstein (1997), “Cities and Growth: Theory and Evidence from France and Japan”, Regional Science and Urban Economics, 27(4-5):443-474.
Glaeser, Edward, Jose Scheinkman, and Andrei Shleifer (1995), “Economic Growth in a Cross-Section of Cities”, Journal of Monetary Economics, 36:117-143.
Henderson, Vernon, and Anthony Venables (2009), “Dynamics of City Formation”, Review of Economic Dynamics, 2:233-254.
Henderson, Vernon, and Hyoung Wang (2007), “Urbanization and City Growth: The Role of Institutions”, Regional Science and Urban Economics, 37(3):283-313.
Ioannides, Yannis, and Henry Overman (2003), “Zipf’s Law for Cities: An Empirical Examination”, Regional Science and Urban Economics, 33(2):127-137.
World development report: Reshaping economic geography (2009), The World Bank.
1 Including the square of the number of cities/MAs does not alter the rest of the estimates. These coefficients are statistically insignificant for both units of analysis.
2 Including the square of the number of cities/MAs does not alter the rest of the estimates. These coefficients are statistically insignificant for both units of analysis.


