From 2007 to 2010, the Irish public debt-to-GDP ratio rose roughly 20% annually, taking it from among the lowest among OECD countries in 2007 (25%) to among the highest in 2010 (96%). Irish banks had looked increasingly vulnerable in the autumn of 2008 with their credit default swap (CDS) spreads – which is just the cost of buying protection against bond default – having reached a peak (on average across the four largest banks) of over 400 basis points in September 2008. While Irish bank CDS stabilised to 150 basis points following the Irish government’s announcement of a blanket guarantee of all creditors of Irish banks on 30 September 2008, the post-bailout period saw Irish sovereign and bank CDS co-move strongly, with both increasing to over 600 basis points by the start of 2011. (See Kelly 2010 on this site for a contemporary account.)
At the other end of Europe, the Italian government had maintained a debt-to-GDP ratio to 100% even before 2007. While the Italian banks were stable at CDS spreads of close to 100 basis points (bps) in 2007, the Italian sovereign CDS widened steadily from 2007 to 2010, reaching nearly 600 bps in 2011 (see Gros 2011 on this site for a fuller analysis). By this time, the Italian banks were also assessed in credit markets at a significantly higher risk of over 600 bps. The situation in Greece was similar, indeed worse, with Spain and Portugal sitting somewhere in between the case of Ireland and the cases of Greece and Italy. All of these countries experienced severe growth contractions during 2007–11.
The pan-European patterns were similar: the average pre-bailout quality of the banking sector and the size of government debt predict future sovereign risk. Figure 1a looks at the quality of the banking sector. It shows that the change in sovereign CDS over the period from the first bailout announcement (26 September 2008), following the collapse of Lehman Brothers, until the last bailout announcement of 2008 (21 October 2008), was related positively to the average pre-bailout (as of 26 September 2008) CDS of banks based in that sovereign. This pattern survives if the post-bailout period is extended until the first European stress tests of spring 2010, as shown in Figure 1b.
In both Figures 1a and 1b, we see that in both Ireland and Spain banks had the highest pre-bailout CDS and their sovereign CDS also widened substantially.
Figure 1a. Average bank CDS before bailouts predicts sovereign CDS after bailouts (short-run)1
Figure 1b. Average bank CDS before bailouts predicts sovereign CDS after bailouts (long-run)2
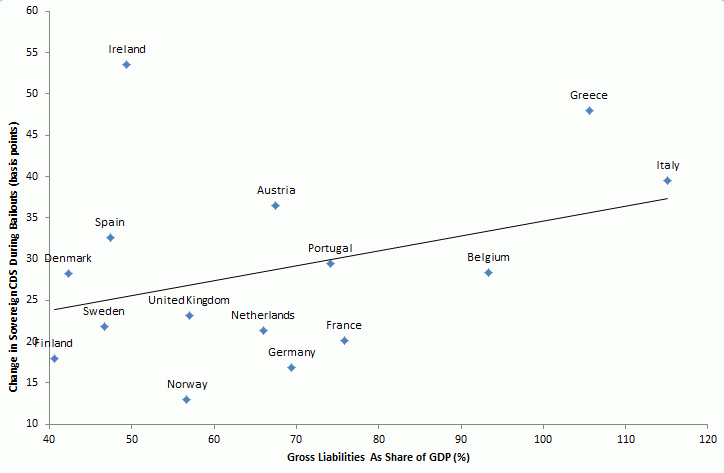
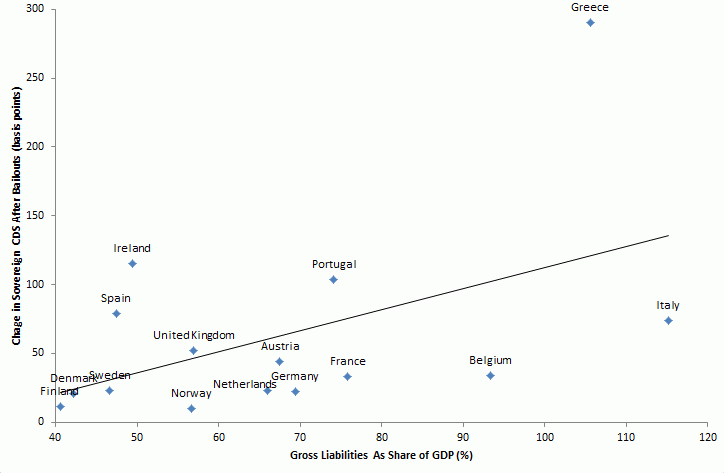
Figures 2a and 2b look at the size of government debt. They show that the sovereign CDS change was also related positively to the pre-bailout sovereign debt-to-GDP ratios, Italy and Greece being the highest ratios and also experiencing significant credit deterioration.
Figure 2a. Debt-to-GDP ratio before bailouts predicts sovereign CDS after bailouts (short-run)3
Figure 2b. Debt-to-GDP ratio before bailouts predicts sovereign CDS after bailouts (long-run)4
A tale of two debt overhangs
We argue in Acharya et al (2010) that these relationships between financial and sovereign credit risks, and economic growth, are not just pure accidents, but in fact represent a tale of two debt overhang problems.
- When financial sectors are under-capitalised, as they were after the global crisis losses, economic growth can collapse (de-leveraging by financial institutions creates a credit crunch).
- To avoid such a credit crunch and loss of real sector output, governments engage in large-scale, often blanket, financial-sector bailouts.
Such bailouts, however, are costly and run the risk of amounting to a ‘Pyrrhic victory’ for the sovereigns.
- First, bailouts require immediate issuance of additional debt by the sovereign in order to backstop the creditors of distressed or insolvent financial firms.
This leads to an immediate increase in the sovereign’s credit risk through the liability side of its balance sheet.
- Second, and perhaps even more importantly, the sovereign runs the risk of becoming indebted to the point where another debt overhang can take hold in its economy.
The private sector – households and corporations – anticipate that the sovereign’s additional debt will require higher taxes in the future. This dilutes long-run returns on real-sector and human-capital investments. The resulting under-investment in the economy can cause growth and productivity in the sovereign to slow down, affecting the sovereign’s credit risk through the asset-side of its balance sheet.
This creates a tradeoff between the two overhangs:
- Sovereigns may need to ‘sacrifice’ their creditworthiness to alleviate the financial sector’s overhang.
- The resulting rise in sovereign credit spreads induced by this ‘sacrifice’ is consistent with the patterns in Figure 1 and 2, as are downwards revisions in expectations of growth in the fall 2008.
Negative feedback loops
The intertwining, however, does not stop there.
- As sovereigns are the ultimate insurer of their banks, deterioration in the sovereign’s creditworthiness introduces the risk that its credit problems will feed back adversely onto its financial sector.
- One channel through which this occurs is the significant direct holdings of government debt by the financial sector.
The stress test data revealed by the European regulators in June 2010 (on positions as of 31 March 2010) show that for every €6 of risk-weighted assets, the 91 stress-tested European banks held on average €1 of sovereign bonds.
Figure 3 shows the extent of ‘home bias’, the proportion of the sovereign debt that was held by banks in a given country in the form of the country’s own bonds. The home bias in government bond holdings is on average close to 60%, and is particularly strong for banks of troubled sovereigns (Greece, Ireland, Portugal, Spain, and Italy). The home bias of sovereign debt holding by banks creates one form of reverse feedback from sovereign to the financial sector.
Figure 3. Home bias in government debt5
As Figure 4 shows, the credit quality of European banks as of the stress tests in March 2010 – by when sovereign problems had begun to fester – was indeed related to the extent of their (respective) home bias.
Figure 4. Home bias in government debt and bank credit risk6
The second form of reverse feedback arises due to the fact that the financial sector – with or without bailouts – is perceived to have creditor guarantees provided by the sovereign.
- Hits to the sovereign’s creditworthiness trickle-down to the financial sector’s credit quality.
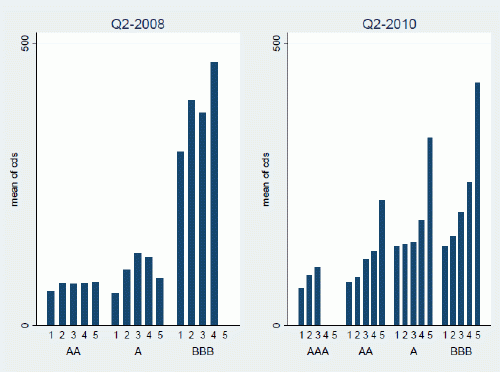
The Spanish bank Banco Santander is a good example. Despite being the most profitable Eurozone bank since 2007, it had to pay more to borrow in October 2010 than weaker German banks. Figure 5 shows that that this pattern holds across Europe.
Figure 5. Quarterly bank CDS by credit rating and country CDS for Q2 2008 and Q2 20107
Figure 5 is generated by assigning to each bank the sovereign CDS of the country where it is headquartered. We then group countries in five quintiles using sovereign CDS and compute average banks CDS by credit ratings and by country quintile. The Figure shows that:
- Keeping credit ratings constant, bank CDS monotonically increase in country quintiles;
- This is weakly so in the left panel (before the bank bailouts in second quarter of 2008), and
- It is strongly true after the 2010 European bank stress (second quarter of 2010).
These results suggest that an increase in sovereign CDS increases bank credit risk even after controlling for bank credit ratings, as an increase in sovereign CDS weakens the quality of implicit guarantees for bank creditors.8
Both of these reverse feedbacks – the first due to direct holdings of government bonds by financial firms, and the second due to implicit guarantees of the financial sector by governments – would further result in withdrawal of intermediation by banks, exacerbating sovereign credit risks, and giving rise to severe downward spirals of growth.
Concluding remarks
The nexus of debt overhangs and credit risks between the sovereign and the financial sectors that we have highlighted has an important policy implication as concerns risk-ratings for sovereign debt.
- Sovereign bonds are accorded minimal, often zero, risk weights in capital requirements for banks as long as sovereigns are well rated.
- Yet the nexus of debt overhangs mean that even small deteriorations in the credit quality of sovereigns can precipitate financial and economic crises.
It may therefore be prudent – even in good times for well-rated sovereigns – to entertain the ‘stress test’ possibility of future credit deterioration. This suggests:
- Non-zero risk weights on sovereign bonds, and
- Requirements on banks to fund sovereign bond holdings with reasonable quantities of capital.
Not doing so can result in excessive funding of sovereigns by banks in good times, but with sharp reversals in bad times, as is currently being witnessed in the Eurozone.
Authors' note: This article is based on our piece with the same title appearing in the special issue of Banque de France’s Financial Stability Review on “Public Debt”, to be released on April 21 2012 (http://www.banque-france.fr/en/publications/financial-stability-review.html).
References
Acharya, Viral V, Itamar Drechsler, and Philipp Schnabl (2010), “A Pyrrhic Victory? Bank Bailouts and Sovereign Credit Risk”, Working paper, NYU-Stern, CEPR Discussion Paper 8679.
Gros, Daniel (2011), “Can Italy survive the financial storm?”, VoxEU.org, 19 December.
Kelly, Morgan (2010). “Whatever happened to Ireland?”, VoxEU.org, 17 May.
1 This Figure shows the relation between average bank CDS by country before the bank bailouts (as of 26 September 2008) and the increase in sovereign CDS after the bank bailouts (from 26 September 2008 to 21 October 2008). The bank and sovereign CDS data are from Datastream. We include all European countries with available data on sovereign CDS and bank CDS.
2 This Figure shows the relation between average bank CDS by country before the bank bailouts (as of 26 September 2008) and the increase in sovereign CDS after the bank bailouts (from 26 September 2008 to the European bank stress tests on 31 March 2010). The bank and sovereign CDS data are from Datastream. We include all European countries with available data on sovereign CDS and bank CDS.
3 This Figure shows the relation between the debt-to-GDP ratio before the bank bailouts (as of 1 July 2008) and the increase in sovereign CDS after the bank bailouts (from 26 September 2008 to 21 October 2008). The debt-to-GDP ratios are from the OECD and the sovereign CDS data are from Datastream. We include all European countries with available data on sovereign CDS and debt-to-GDP ratio.
4 This Figure shows the relation between the debt-to-GDP ratio before the bank bailouts (as of 1 July 2008) and the increase in sovereign CDS after the bank bailouts (from 26 September 2008 to the European bank stress tests on March 31st, 2010). The debt-to-GDP ratio are from the OECD and the sovereign CDS data are from Datastream. We include all European countries with available data on sovereign CDS and debt-to-GDP ratio.
5 This Figure shows the average holdings of home sovereign debt as a share of total sovereign debt by country as of the European bank stress tests on 31 March 2010. The holdings are computed based on data released during the 2010 European bank stress test.
6 This Figure shows a positive association between home bias in government debt and bank credit risk (proxied for by the natural logarithm of a bank’s credit default swap) as of the European bank stress tests on 31 March 2010. Home bias in government debt is total home sovereign debt as a share of total sovereign debt. Home bias is computed from data released as part of the 2010 European bank stress tests. The bank CDS data are from Datastream. We include all banks that are included in the 2010 bank stress tests and that have bank CDS data.
7 This Figure plots average banks CDS by credit rating and CDS country quintile for Q2 2008 and Q2 2010. We construct the country quintiles (1 to 5) based on sovereign CDS for each quarter. Next, we average bank CDS for each country quintile and each investment grade credit rating. The left hand panel shows that that was only a weak relationship between sovereign CDS and bank CDS for a given bank credit rating in the second quarter of 2008. The right hand side panel shows that there was a strong and positive relationship between sovereign CDS and bank CDS in the second quarter of 2010. The CDS data are from Datastream and credit ratings data are from S&P RatingsXpress.
8 In another example, Santander sold in September 2010 €1 billion ($1.4 billion) of 4.125%, seven-year senior bonds with a AA rating that yield 156 basis points more than average market rates. In contrast, Germany’s Commerzbank AG, which required a government rescue in 2008, issued €1 billion of 4%, 10-year senior debt with an A rating that yield 126 basis points more than the benchmark.


