How important are policy barriers to trade? Historically, this question has been difficult to answer because, as noted by Anderson and van Wincoop (2004), "[t]he grossly incomplete and inaccurate information on policy barriers available to researchers [was] a scandal and a puzzle."
The recent literature assessing the effect of trade policy on trade flows can be divided between the econometric analyses of the gravity model, surveyed by Head and Mayer (2014), and evaluation of calibrated quantitative trade models, summarised by Costinot and Rodriguez-Clare (2014). Both approaches seek to understand bilateral trade flows, and they both use aggregated summary measures of trade policy. We argue that future research could be enriched by incorporating micro-level data on trade policy from a number of newly available sources.
To facilitate new research directions, we survey a number of relatively new databases regarding different trade policies for 31 economies that represented 83% of the world's population and 91% of the world's GDP in 2013 (Bown and Crowley, forthcoming). We document the extent of cross-sectional heterogeneity in applied commercial policy across countries, their economic sectors, and their trading partners, over time. We address five questions about contemporary trade policy: (1) Do some countries have more liberal trading regimes than others? (2) Within countries, which industries receive the most import protection? (3) How do trade policies change over time? (4) Do countries discriminate among their trading partners when setting trade policy? (5) How liberalised is world trade?
Here we focus on the first two questions.
Do some countries have more liberal trading regimes than others?
The answer to this question is easy and fairly well known if we limit our analysis to applied most-favoured-nation (MFN) import tariffs. As we show below, yes, there remain large differences across countries in the average level of import tariffs. High-income countries have more liberal regimes than middle-income countries which, in turn, have more liberal regimes than low-income countries.
However, the answer becomes more complicated once we look beyond applied MFN tariffs. For example, high-income countries appear even more open when we expand the set of policies to include preferential import tariffs that they offer to select trading partners. However, both high-income and emerging economies appear less open when we expand the set of policies beyond tariffs to include temporary trade barriers (antidumping, safeguards, countervailing duties) and quantitative restrictions.
Within countries, which industries receive the most import protection?
We use this question to showcase the important nuances captured by different trade policies. The answer depends not only on the country, but also on the trade policies examined within a country.
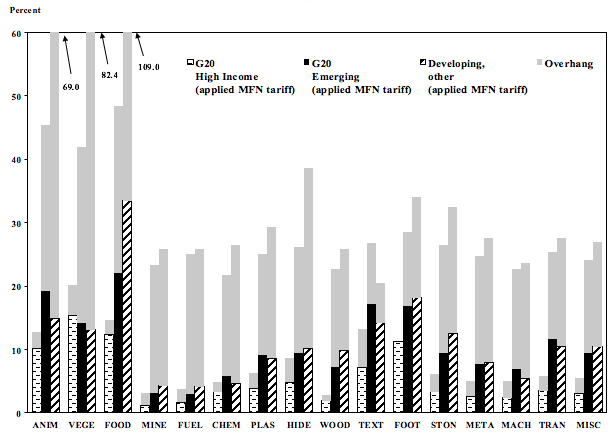
Figure 1 illustrates average tariff rates for three country groups and 16 industrial sectors in 2013. The three country groups correspond to the G20 high-income economies, the G20 emerging economies, and another group of 15 relatively large developing countries.1 The sectors span the universe of Harmonised System product categories.
For each country-group and industrial sector pair, we report two measures of tariffs. The first is the average applied MFN tariff; this is the rate imposed on most imports. The second measure, represented by the grey-shadowed bars, is the average of the tariff commitment for each group of countries, i.e., the average of the maximum tariff rate permitted under the WTO.2 The difference between the average tariff commitment and average applied rate captures some of the inherent trade policy uncertainty for each group of countries in 2013. Figure 1 illustrates a number of relatively clear patterns.
Figure 1. Average applied MFN tariffs in 2013 and tariff bindings, by industry and country group
Source: Bown and Crowley (forthcoming, Figure 2). MFN=most favoured nation. Horizontal axis are 16 different industrial sectors spanning all products in the Harmonised System.
First, high-income countries have lower average applied tariffs than emerging economies and other developing countries almost universally across sectors.
Second, agricultural products and foodstuffs are protected almost everywhere, regardless of a country's level of development. Within manufacturing, textiles, apparel and footwear are more protected than other industrial goods. Minerals and fuels tend to face few import barriers.
Third, there are substantial differences in the stringency of tariff commitments across groups of countries. For the high-income countries, there is very little difference between applied tariff rates and maximum permissible tariff rates across all sectors. This implies that WTO commitments are binding for most products imported into high-income economies.
In sharp contrast, there are large differences between the average tariff commitment and the average applied tariff for emerging and developing countries across all sectors. This difference, referred to as ‘tariff overhang,’ means that most of these economies have considerable ‘policy space’ to raise their import tariffs while maintaining their international commitments to the WTO.3
Figure 1 thus illustrates why an empirical study of trade policy that is limited to applied tariff rates at a particular moment in time could be misleading. The cross-country differences in tariff commitments are considerably larger than differences in applied tariffs. If firms that consider entering a foreign market care about the expected future tariff rate, how should they form that expectation? These data suggest that exporters to emerging and developing economies face considerably more uncertainty regarding future import tariffs than they face in exporting to high income economies.
A number of recent studies have examined how trade agreements and policies that reduce trade policy uncertainty impact exports and firm-level investments (Handley and Limão 2015a, Handley 2014). Further, a growing literature analyses the effect of the `China shock,’ that is, China’s unprecedented export growth in the 2000s, on output and employment growth in U.S. import-competing sectors (Handley and Limão 2015b, Pierce and Schott forthcoming, Autor et al. 2013, 2016). This research is implicitly tied to the reduction in trade policy uncertainty facing Chinese exporters that came about when China joined the WTO.
Trade policy measures beyond tariffs
Evaluating the sector-level variation in import protection becomes much more complicated once we look beyond tariffs. Temporary trade barriers (TTBs) are import restrictions permitted under the WTO’s numerous contingency clauses; importantly, these import restrictions are not captured by the summary data on tariffs in Figure 1. Given that countries apply these TTBs in many forms – e.g. as ad valorem tariffs, specific tariffs, quantitative restrictions, or ‘voluntary’ agreements to raise export prices – we measure their use with the import coverage ratio. This is defined as the share of imported products within each sector over which the country imposed a TTB between 1995 and 2013.
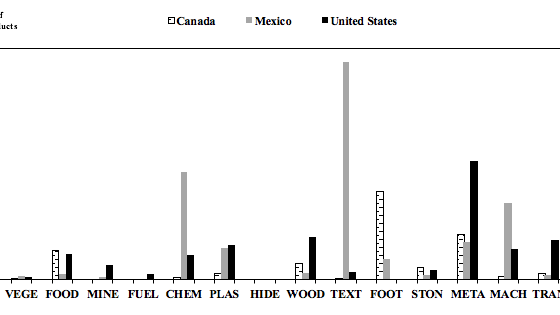
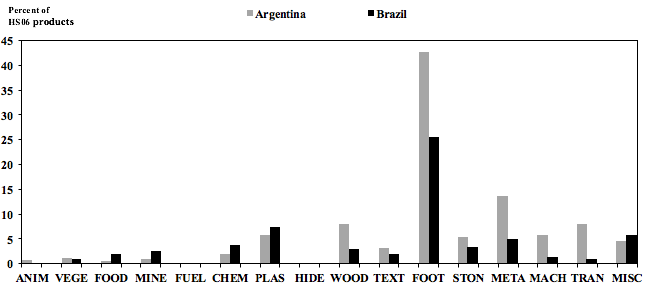
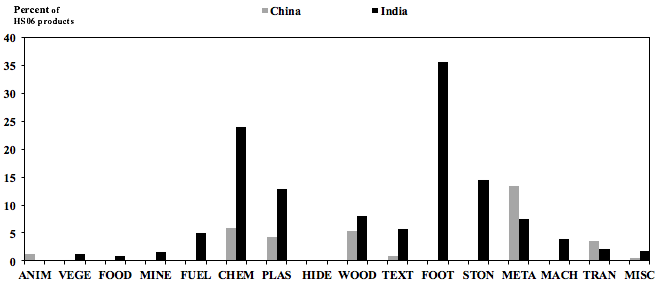
Figure 2 summarises the importance of TTBs in different sectors across major high income and emerging economies. To interpret, focus on the top panel. At some point over 1995-2013, the US imposed TTBs on approximately 40% of imported products in its metals and steel. Over the same period, Mexico imposed TTBs on approximately 40% of imported products in chemicals.
Figure 2. Import products with an imposed temporary trade barrier in effect over 1995-2013, by policy-imposing economy and industry
Source: Bown and Crowley (forthcoming, Figure 11). TTB=temporary trade barriers of antidumping, countervailing duties and safeguards. G20=Group of 20. Horizontal axis are 16 different industrial sectors spanning all products in the Harmonised System.
Now compare Figure 2 with Figure 1. In general, Figure 1 revealed that all three types of countries tended to apply low tariffs in chemicals, plastics, metals and steel, and machinery. However, Figure 2 indicates that both high income and emerging economies frequently use TTBs to restrict a large share of imports in these same sectors. Again, this implies that an analysis of exporters’ responsiveness to trade policy that relies on the applied MFN tariff rate would miss much of the policy variability that exists in the real world.
Finally, to tie this back to the China shock, consider Figure 3. Figure 3 presents information on exporters facing temporary trade barriers (TTBs) in G20 markets in 2013. The graph displays data for the 10 exporting countries that faced the most TTBs. The left axis presents the value of exports (billions of US dollars) for products facing G20-imposed TTBs, and the right axis presents the share of the country’s total exports to the G20 facing G20-imposed TTBs.
Not surprisingly, Figure 3 indicates that China is the top export target of TTBs, with an estimated $100 billion in exports subject to G20-imposed import restrictions in 2013. This is more than 7 times larger than the second most-targeted exporting country, South Korea, at $14 billion and the third most-targeted country, the United States, at $12.6 billion. Alternatively, more than 7% of China’s total exports to the G20 markets were subject to foreign-imposed TTBs in 2013, as compared to roughly 4% of Korea’s exports and only 1% of US exports.
Figure 3. Top 10 exporting countries most exposed to foreign-imposed TTBs, 2013
Source: constructed from Bown and Crowley (forthcoming, Table 6). Top 10 targets are measured in value terms (left axis) and ranked from left to right. Right axis is trade-weighted shares of total exports to G20 subject to foreign-imposed TTBs, where TTB=temporary trade barrier of antidumping, countervailing duties and safeguards.
In terms of policy, Figure 3 documents that while China’s WTO membership in 2001 gave China almost duty-free access in many markets, the US and other G20 economies subsequently restricted this market access through the imposition of TTBs – and antidumping in particular – on imports from China.4
One potentially fruitful path for the literature on the China shock and trade policy uncertainty would be to exploit the considerable variation in TTB import protection across products and time. Researchers can use this data to push beyond the US import experience of the 2000s and examine the impact of the China shock on other importing countries. Many emerging markets also used TTBs to address increased imports from China during this period; some did so even more intensively than the US (Bown 2013).
Conclusions
The days in which research could rely on applied import tariffs alone to capture the critical variation in trade policy are probably drawing to a close. Governments currently use a multitude of policy tools to restrict imports at the border that are not captured by summary statistics on applied tariff rates. However, the opportunities to examine responses to trade policy changes are growing – databases of highly detailed product- and partner-specific trade policies are now available to researchers.
References
Anderson, James E. and Eric van Wincoop (2004) “Trade Costs,” Journal of Economic Literature 42(3): 691-751.
Autor, David, David Dorn, and Gordon Hanson (2013) "The China Syndrome: Local Labor Market Effects of Import Competition in the United States," American Economic Review 103(6): 2121-2168.
Autor, David, David Dorn, and Gordon Hanson (2016) "The China Shock: Learning about Labor Market Adjustment to Large Changes in Trade,” Annual Review of Economics 8, forthcoming.
Bown, Chad P. (2013) “Emerging Economies and the Emergence of South-South Protectionism," Journal of World Trade 47(1): 1-44.
Bown, Chad P. and Meredith A. Crowley (forthcoming) “The Empirical Landscape of Trade Policy,” in Kyle Bagwell and Robert W. Staiger (eds.), The Handbook of Commercial Policy, Netherlands: Elsevier, forthcoming (chapter 1). Available as CEPR Discussion Paper No. 11216.
Costinot, Arnaud and Andres Rodriguez-Clare. 2014. “Trade Theory with Numbers: Quantifying the Consequences of Globalization,” in Handbook of International Economics, Vol. 4. North-Holland, Gita Gopinath, Elhanan Helpman, and Kenneth Rogoff, eds.
Handley, Kyle (2014) “Exporting under trade policy uncertainty: Theory and evidence," Journal of International Economics 94(1): 50-66.
Handley, Kyle and Nuno Limão (2015a) “Trade and Investment under Policy Uncertainty: Theory and Firm Evidence,” American Economic Journal: Economic Policy 7(4): 189-222.
Handley, Kyle and Nuno Limão (2015b) “Policy Uncertainty, Trade and Welfare: Theory and Evidence for China and the U.S." Mimeogr., University of Maryland.
Head, Keith and Thierry Mayer. 2014. “Gravity Equations: Workhorse, Toolkit, and Cookbook,” in Handbook of International Economics, Vol. 4. North-Holland, Gita Gopinath, Elhanan Helpman, and Kenneth Rogoff, eds.
Pierce, Justin and Peter K. Schott (forthcoming) “The Surprisingly Swift Decline of U.S. Manufacturing Employment,” American Economic Review.
Endnotes
[1] The G20 high-income economies are Australia, Canada, the EU, Japan, Korea, Saudi Arabia and the US. The G20 emerging economies are Argentina, Brazil, China, India, Indonesia, Mexico, Russia, South Africa, and Turkey. The other developing countries are those that each have populations in excess of 40 million.
[2] WTO members typically establish a maximum tariff rate for each Harmonised System product that they import. The average tariff commitment for each group is the simple average of this maximum tariff rate over all products for all countries within the group.
[3] Notably, the exceptions, which have quite stringent tariff commitments, are emerging economies which began the process for joining the WTO after 1996, including China, Russia, Vietnam and Ukraine.
[4] For example, Bown and Crowley (2016, Table 6) find that only 3.3% of China’s exports to Australia, Canada, EU, US were subject to TTBs in 1995. The growth in import restrictions against Chinese exports over time is at least partly due to increased restrictions in emerging economies.
