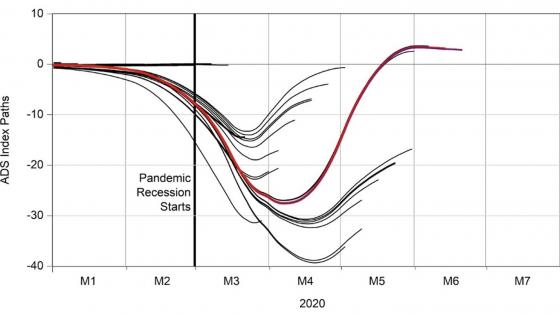
The recent decade has shown that forecasters need to continuously adapt their tools to cope with increasing macroeconomic complexity. Just like the global crisis, the current Covid-19 pandemic highlights once again that forecasters cannot be content with just assessing the single most likely future outcome – such as a single number for future GDP growth in a certain year. Instead, a characterisation of all possible outcomes (i.e. the entire distribution) is necessary to understand the likelihood and nature of extreme events.
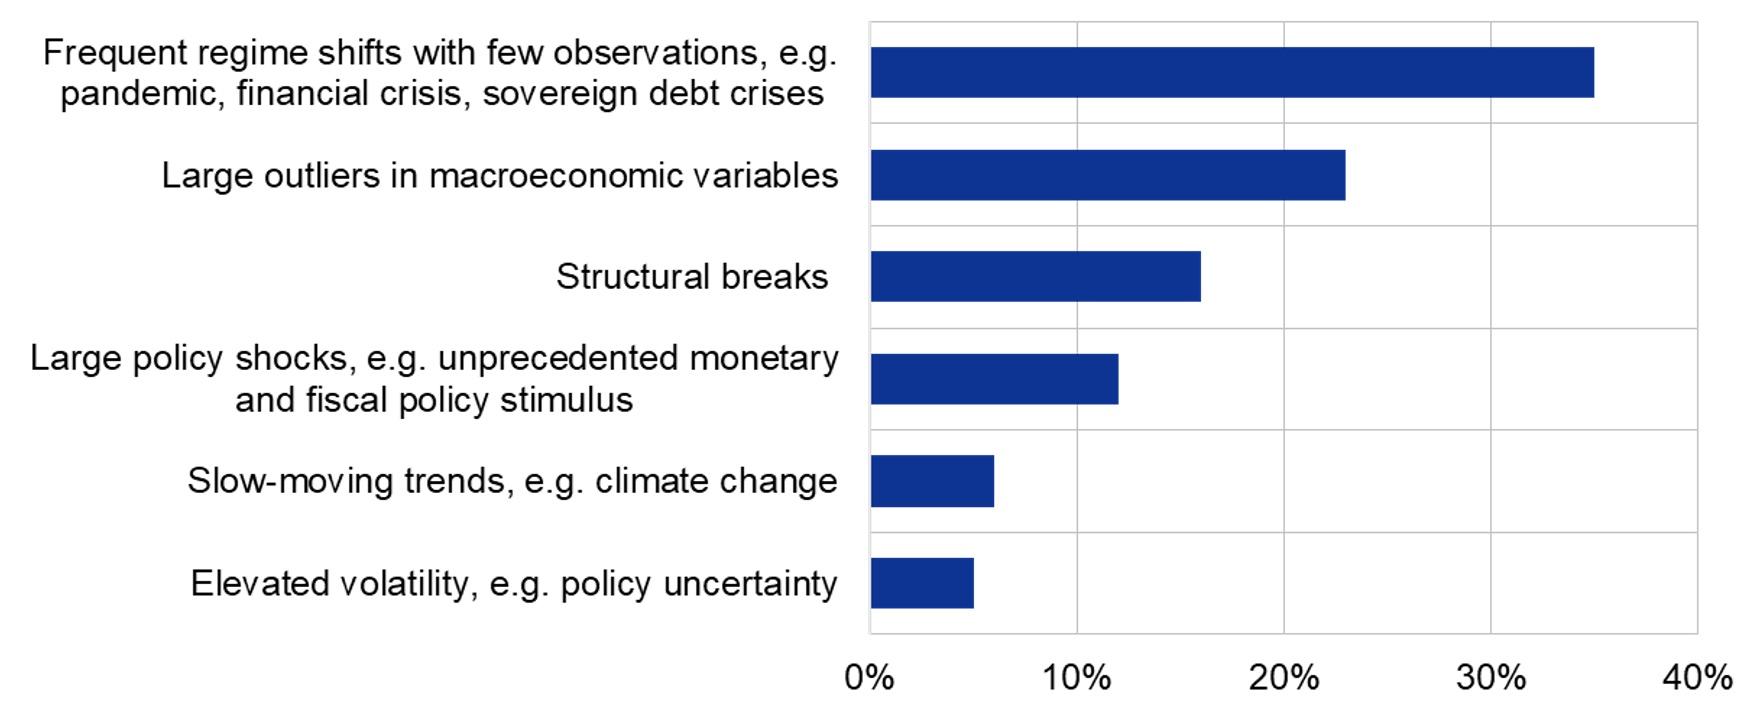
This is key for central bank forecasters as well, as pointed out by ECB Executive Board member Philip Lane in his opening remarks at the 11th Conference on Forecasting Techniques. Central banks rely heavily on forecasts to design their policy and need robust techniques to navigate through turbulent times. They not only ensure price stability and are thus directly interested in the most likely future inflation path, but in the process also contribute to the understanding, managing, and handling of macro-economic risks and thus need to grasp the likelihood of extreme events (see also the discussion in Greenspan 2004). To enhance the collective understanding of new techniques which could potentially cope with the challenges posed by extreme events (e.g. pandemics, natural disasters such as floods or wildfires) and shifting trends (e.g. climate change, demographics), the ECB dedicated the conference to “forecasting in abnormal times”. The conference participants – leading experts in the field – considered regime shifts and large outliers as particularly important challenges for central bank forecasters at the current juncture (Figure 1) and this is what many of the presentations tackled.
Figure 1 What is the primary challenge in macroeconomic forecasting in central banks right now?
Source: Survey of leading forecasting experts within 11th ECB Conference on Forecasting Techniques (75 replies).
Many of the contributions covered either of two strategies for improving forecasting models in a forecasting landscape dominated by the Covid-19 pandemic. The first strategy amounts to sheltering standard forecasting models (such as VARs and factor models) against extreme events. The second strategy aims at explicitly modelling economic dynamics in extreme states of the economy, acknowledging that economic variables interact differently in such cases. Whereas these two strategies currently evolve rather independently, they could complement each other going forward.
Bringing the classical approach up to speed
Several recent studies propose ways to make the classical vector autoregression (VAR) model work through turbulent times. The large shocks during the Covid-19 pandemic have such strong effects on parameter estimates that they can lead to implausible forecasts. While it is straightforward to cope with a single extreme observation by outlier correction, this approach reaches its limits in case of a sequence of large shocks. Recent studies propose to place less weight on Covid-19 observations by allowing for a higher volatility of the associated residuals (Lenza and Primiceri 2020). Carriero et al. (2021) propose an alternative approach which combines stochastic time variation in volatility with an outlier correction mechanism. In his keynote speech, Joshua Chan pointed out that stochastic volatility is a long-standing feature of macro-economic data and that accounting for it improved the forecasting properties of large-scale VARs already prior to Covid-19. In his keynote speech Chris Sims argued that structural shocks hitting the economy are better understood (and identified) by examining changes in the co-occurrence of large fluctuations in multiple key macroeconomic quantities. VARs are a workhorse model, hence the focus on them. But actually, it is not only VARs that are affected by the abnormal observations. This is the case also for most other standard time series models and in fact also for fully-fledged structural models, i.e. dynamic stochastic general equilibrium models (DSGEs), which are also being adapted to account for the unprecedented nature of the pandemic shock (Cardani et al. 2020).
Forecasting benefits from bringing in relevant off-model information, such as expert judgement. This holds even more so under extreme events. Banbura et al. (2021) show that enriching pure model-based forecasts with information provided by the survey of professional forecasters can be a valid way to improve the forecasting performance.
The new ambition: Modelling the entire distribution and non-linearities
If extreme events become more frequent, policy must pay even more attention to possible tail outcomes. In contrast to the strategy described in the previous section, which largely neutralises extreme events, the second strategy tries to tackle extreme events head-on by explicitly modelling their dynamics.
One line of work starts from the observation that economic dynamics partly depend on the state of the economy. For instance, dynamics may differ between a deep recession and an expansion. The increasingly popular ‘growth-at-risk’ (GaR) approach explores this possibility by modelling the dependence of economic dynamics on the direction and the size of the most recent shocks. In this way it allows for different dynamics during a crisis (see Korobilis et al. 2021 for an application to inflation). Gonzalez-Rivera et al. (2021) build on the growth-at-risk approach, arguing that for measuring vulnerabilities under extreme events such as a pandemic one should think in terms of scenarios. Their approach is inspired by the stress-testing literature, which had been developed to grasp tail risk in financial markets. The combination of the growth-at-risk approach with scenarios for selected extreme economic developments provides a way to understand how the economy is affected by large shocks. Caldara et al. (2021) show that regime-switching models provide a promising alternative to the growth-at-risk approach.
A more recent and more radical approach to handle non-linear economic dynamics in a flexible way is inspired by machine learning techniques. Several approaches combine time series techniques with regression trees. These techniques model state dependence by piece-wise linear models defining the states by purely data-driven methods. To avoid overfitting, shrinkage and model averaging techniques have long been used to focus on the most relevant predictors. In the context of machine learning, shrinkage helps to achieve robust outcomes by averaging across many trees, such as ‘random forests’ (Coulombe, 2021) or in combination with Bayesian techniques (Clark et al. 2021). The latter show that this flexible modelling of non-linearities can help with forecasting not only the conditional mean but also tail risk. The winning paper in the PhD student competition (Kutateladze 2021) applies a ‘kernel trick’ to estimate non-linear dynamic factor models with highly non-linear patterns.
The new developments are data-intensive, and their growing popularity is thus closely linked to the emergence of big data. Even with big data, though, the modelling of non-linearities may remain fragile. Higher model complexity comes with a lack of robustness and the ‘black box’ critique. It is possible to enhance the interpretability of machine learning techniques via post-estimation analysis (Buckmann et al. 2021). At this juncture the lasting success of these models remains to be seen.
Complements, not substitutes
The two strategies laid out in this column evolve rather independently in the current literature, but they could complement and enrich each other going forward. Our conference survey shows that the classic approach has by no means become obsolete: more than half of the participants indicated that they are using VARs in their work. At the same time, there is a broad consensus that more research on new indicators and on modelling nonlinear dynamics is necessary (Figure 2). For that, the classic and the new approach may learn from each other. The conference revealed some gaps, which can be filled via the complements between the two approaches.
Figure 2 Which are the most important avenues for future research in forecasting?
Source: Survey of leading forecasting experts within the 11th ECB Conference on Forecasting Techniques (46 replies). Two response options were allowed.
Learning about the nature of non-linearities helps make linear models more robust. The wide range of big datasets available allows for constructing statistics which capture nonlinearity or risk at a higher frequency than ever before. In this way, certain types of nonlinearities may be introduced into linear models from microeconomic indicators. Conversely, the success of new indicators in linear models for capturing nonlinearities in the economy might inspire the development of targeted nonlinear models. This coincidence of wants might be reflected in ‘big data’ ranked as the most important research avenue by conference participants (Figure 2).
High-frequency and big data already brought substantial gains in the now-casting of the economy. During the early Covid-19 crisis, due to the unprecedented speed with which economic events were unfolding, novel high-frequency variables such as credit card data, mobility data, Google Trends, or booking information proved to be extremely useful in the real-time monitoring of economic developments (see Antolin-Diaz et al. 2021 or Woloszko 2020 detailing the OECD Weekly Tracker). This also came along with technical innovations on dealing with the short history of these data, the implications of time-varying uncertainty for updating the forecasts with incoming news (Labonne, 2020), and on the robust forecasting of highly non-stationary series (Castle et al. 2020, 2021).
Appreciating (forecasts of) uncertainty
Uncertainties have increased over the last years, and it has become even more pressing to address them properly. Statistical models help translate historical patterns into the present situation. Inevitably, this did not work too well during the pandemic, which can be viewed as historically unique. The Covid-19 shock is not the usual macroeconomic shock, as discussed early on in the pandemic by Baldwin and di Mauro (2020). In such situations, one should strike for a balance between the predictions based on statistical models and those based on economic reasoning, for instance via theoretical models.
Appropriately measuring uncertainty is important on its own. After all, uncertainty is not a lack of precision. Chris Sims vividly pointed out that there is a tendency for model developers and users to say that a model yielding very high uncertainty bands is ‘not precise’. But this high uncertainty might in fact be an appropriate description of the state of the economy. Therefore, policymakers should encourage models that say exactly how big the uncertainty is, even when it is unpleasant news.
Authors’ note: Papers, presentations, and videos of the conference can be viewed on the conference website here. The views expressed are those of the authors and do not necessarily reflect those of the ECB.
References
Antolin-Diaz, J, T Drechsel and I Petrella (2021), “Advances in nowcasting economic activity: secular trends, large shocks and new data”, CEPR Discussion Paper 15926.
Baldwin, R and B Weder di Mauro (eds.) (2020), Economics in the Time of COVID-19, CEPR Press.
Bańbura, M, F Brenna, J Paredes and F Ravazzolo (2021), "Combining Bayesian VARs with survey density forecasts: does it pay off?", Working Paper 2543, European Central Bank.
Buckmann, M, A Joseph and H Robertson (2021), "An interpretable machine learning workflow with an application to economic forecasting", mimeo.
Caldara, D, D Cascaldi-Garcia, F Cuba-Borda and F Loria (2021), “Understanding growth-at-risk: A Markov switching approach”, mimeo.
Cardani, R, O Croitorov, F Di Dio, L Frattarolo, M Giovannini, S Hohberger, P Pfeiffer, M Ratto and L Vogel (2021), “The euro area’s COVID-19 recession through the lens of an estimated structural macro model”, VoxEU.org, 8 September.
Carriero, A, T E Clark, M Marcellino and E Mertens (2021), “Addressing COVID-19 outliers in BVARs with stochastic volatility”, Working Paper 202102R, Federal Reserve Bank of Cleveland, revised 09 Aug 2021.
Castle, J, J Doornik and D Hendry (2020), “Short-term forecasting of the coronavirus pandemic”, VoxEU.org, 24 April.
Castle, J, J Doornik and D Hendry (2021), “The value of robust statistical forecasts in the COVID-19 pandemic”, National Institute Economic Review 256: 19-43.
Clark, T E, F Huber, G Koop, M Marcellino and M Pfarrhofer (2021), “Tail forecasting with multivariate Bayesian additive regression trees”, Working Paper 202108, Federal Reserve Bank of Cleveland.
Coulombe, P G (2020), “The macroeconomy as a random forest”, Paper 2006.12724, arXiv.org, revised Mar 2021.
Gonzalez-Rivera, G, V Rodriguez-Caballero and E Ruiz (2021), "Expecting the unexpected: economic growth under stress", Working Paper 202106, University of California at Riverside, Department of Economics.
Greenspan, A (2004), “Risk and uncertainty in monetary policy”, American Economic Review 94: 33-40.
Korobilis, D, B Landau, A Musso and A Phella (2021), “The time-varying evolution of inflation risks”, mimeo.
Kutateladze, V (2021), “The Kernel trick for nonlinear factor modeling”, Paper 2103.01266, arXiv.org.
Labonne, P (2020), “Capturing GDP nowcast uncertainty in real time”, Paper 2012.02601, arXiv.org, revised Dec 2020.
Lenza, M and G E Primiceri (2020), “How to estimate a VAR after March 2020”, NBER Working Paper 27771.
Woloszko, N (2020), “Tracking GDP using Google Trends and machine learning: A new OECD model”, VoxEU.org, 19 December.


