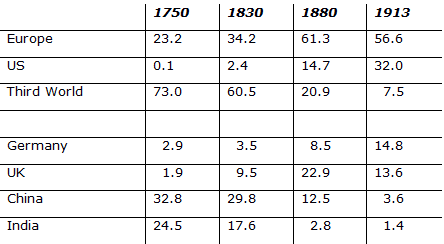
The ‘first globalisation’ of the 19th century – driven by the substantial falls in trade costs associated with the age of steam – saw the ‘First Unbundling’ (Baldwin 2006), in which industrial production and consumption became spatially separated, often by large distances. The period was characterised by the simultaneous processes of industrialisation in Europe and de-industrialisation in Asia (Table 1).
Table 1. Shares of world manufacturing output (%)
Source: Bairoch (1982).
How did Britain do it?
The cotton textiles industry is the quintessential example of the First Unbundling. Throughout the 19th century, Britain was the world leader in cotton textiles, with 69% of the world’s spindles in 1850 and still 58% in 1900 (Farnie and Jeremy 2004). The value chain of this activity was predicated on a globalised world, with its raw material being entirely imported and about 80% of its output being exported in the late 19th century – when Britain still accounted for some three quarters of world cotton textile exports (Leunig 2003). Yet, prior to the Industrial Revolution, cotton textiles were a British importable, and in conditions of free trade the British industry could not compete with India (Broadberry and Gupta 2009). Obviously, it was technological change – notably mechanisation combined with a switch to steam power – that established Britain’s leading role during the Industrial Revolution.
It is remarkable that Britain could maintain its leading position throughout the 19th and early 20th centuries. The technology had become universally known, and Britain was a high-wage country pursuing free trade policies – conditions in which a Heckscher–Ohlin model would predict that the industry would move to Asia. What explains Britain’s success in this first global economy?
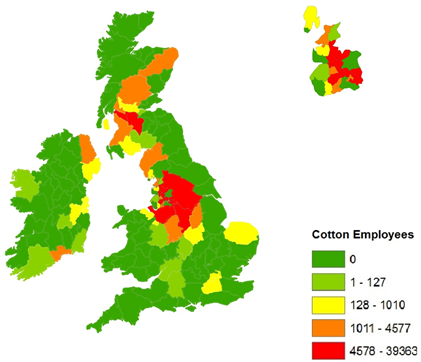
A closer look reveals a key fact. Cotton textiles were extremely spatially concentrated within the UK (see Figure 1).
Figure 1. The location of employment in the cotton industry in Britain 1838
Note: The inlay in the upper-right corner shows Lancashire and its 31 Poor Law Unions.
Source: Crafts and Wolf (2013, Map 2).
- Lancashire, which is about 1.3% of UK land mass and 0.002% of world land mass, was home in 1850 to 66% and in 1903 to 79% of UK spindles – thus in both years accounting for about 46% of world spindles.
New research
Based on a modelling strategy similar to that pioneered by McFadden (1978), our recent paper provides the first serious quantitative attempt to explain the location of cotton textiles in the UK in 1838 – a year for which there is unusually detailed information in a parliamentary report produced by the Factory Inspectors (Crafts and Wolf 2013).
With this framework we test various claims about why the industry came to be so heavily concentrated in Lancashire. In our analysis we distinguish between:
- ‘Original advantages’, such as the availability of water power, the quality of farm land, or local levels of humidity, and
- ‘Acquired advantages’, such as local coal prices and access to markets.
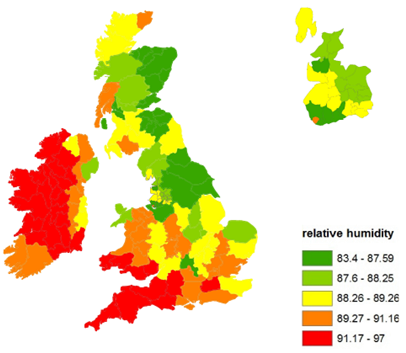
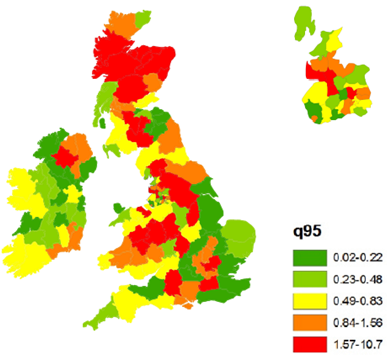
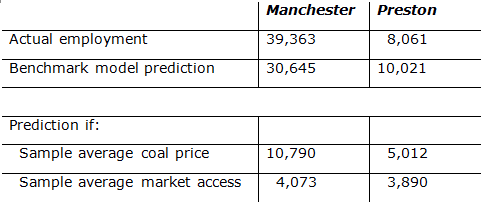
All of these showed wide variations across the UK. Consider for example the differences in humidity levels (Figure 2), available water power (Figure 3) and coal prices (Figure 4). We find that by 1838, compared with the rest of the UK, the key advantages that Lancashire enjoyed included cheap coal and excellent market access. A comparison of actual employment with counterfactual employment based on our empirical model highlights the role of these two ‘acquired advantages’ (see Table 2). If Manchester or Preston – two locations within Lancashire with particularly high levels of cotton textile employment – had possessed only the market access of an average UK location, or had faced coal prices as high as the average UK location, employment would have been substantially lower.
Figure 2. Average relative humidity in %
Note: The inlay in the upper-right corner shows Lancashire and its 31 Poor Law Unions.
Source: Crafts and Wolf (2013, Map 5).
Figure 3. Mean flow data at gauging stations in the UK and Ireland
Note: The inlay in the upper-right corner shows Lancashire and its 31 Poor Law Unions.
Source: Crafts and Wolf (2013, Map 6).
Figure 4. British coal prices (shillings per ton, around 1842)
Note: the inlay in the upper-right corner shows Lancashire and its 31 Poor Law Unions.
Source: Crafts and Wolf (2013, Map 9).
Table 2. Predicted cotton textiles employment in 1838
Source: Derived from Crafts and Wolf (2013, Table 6).
Moreover, we show that these ‘acquired advantages’ had been developed on the back of ‘original advantages’ which included the availability of water power and the relative unsuitability of the area for agriculture in a not too remote location. What made these ‘original advantages’ stick in spite of dramatic technological change was a combination of sunk costs – where steam engines were installed first to complement and later to replace water power – and the emergence of a cotton textile agglomeration. Over time, as Alfred Marshall famously recognised, Lancashire became an extremely successful agglomeration which delivered major productivity benefits from a dense network of suppliers, technological spillovers, a thick labour pool, and marketing expertise (Broadberry and Marrison 2002). In the early 20th century, these agglomeration benefits were fundamental to Lancashire’s ability to compete successfully with the rest of Britain while paying wages that were about a third above the rest of the country (Board of Trade 1909), and with the rest of the world despite paying wages that were six times the Japanese and nine times the Chinese level (Clark 1987).
Conclusions and policy implications
In conclusion, the 19th-century British cotton textiles industry epitomises the insights from models in the new economic geography tradition, such as Krugman and Venables (1995), that predict industrialisation in the core and deindustrialisation in the periphery as trade costs fall, where superior market access and economies of scale interact to the advantage of the core. At the same time, this experience has important lessons for today’s European policymakers confronted by the ‘Second Unbundling’, in which production has become more vertically disintegrated and value chains more spatially dispersed – intensifying the challenge of low-cost Asian competition to the viability of European manufacturing.
The obvious point is that successful agglomerations have productivity advantages that not only can allow relatively high-wage centres to thrive, but are also hard to replicate elsewhere. This suggests that an important role for policy is to facilitate, or at least not to obstruct, the growth of these agglomerations. Three aspects of British economic policy in the 19th century underpinned Lancashire’s success.
- First, the growth of Lancashire cotton towns was not constrained by land-use planning regulations; for example, the population of both Blackburn and Preston increased by a factor of about ten during the 19th century.
- Second, facilitated by parliamentary legislation, the development of the Lancashire cotton industry was supported by substantial private investments in the transport system both in terms of canals and then railways.
- Third, later 19th-century investments in the provision of local public goods significantly reduced not only the health risks of working in textile towns, but also the supply price of labour to the cotton mills (Brown 1990).
In each of these respects it is arguable that the policy stance was more supportive of successful agglomerations back then than it is now; we need to do better. Forward-looking reports such as CPB (2010) have the same message – the most promising route to good European jobs in the globalised economy of the 21st century is to provide an environment in which strong cities can flourish.
References
Bairoch, P (1982), “International Industrialization Levels from 1750 to 1980”, Journal of European Economic History 11: 269–333.
Baldwin, R (2006), “Globalisation: the Great Unbundling(s)”, in Prime Minister’s Office, Globalisation Challenges for Europe, Helsinki: 5–47.
Board of Trade (1909), The Earnings and Hours of Labour of Workpeople of the UK: Textile Trades, HMSO: London.
Broadberry, S and B Gupta (2009), “Lancashire, India, and Shifting Competitive Advantage in Cotton Textiles, 1700–1850: the Neglected Role of Factor Prices”, Economic History Review 62: 279–305.
Broadberry, S and A J Marrison (2002), “External Economies of Scale in the Lancashire Cotton Industry, 1900–1950”, Economic History Review 55: 51–77.
Brown, J C (1990), “The Condition of England and the Standard of Living: Cotton Textile in the North West, 1806–1850”, Journal of Economic History 50: 591–614.
Clark, G (1987), “Why Isn’t the Whole World Developed? Lessons from the Cotton Mills”, Journal of Economic History 47: 141–173.
CPB (2010), The Netherlands of 2040, The Hague.
Crafts, N and N Wolf (2013), “The Location of the UK Cotton Textiles Industry in 1838: a Quantitative Analysis”, CEPR Discussion Paper 9626.
Farnie, D A and D Jeremy (2004), “The Role of Cotton as a World Power, 1780–1990”, in D A Farnie and D Jeremy (eds.), The Fibre that Changed the World: the Cotton Industry in International Perspective, 1600–1990s, Oxford: Oxford University Press: 3–14.
Krugman, P and A J Venables (1995), “Globalization and the Inequality of Nations”, Quarterly Journal of Economics 110: 857–880.
Leunig, T (2003), “A British Industrial Success: Productivity in the Lancashire and New England Cotton Spinning Industries a Century Ago”, Economic History Review, 56, 90–117.
McFadden, D (1978), “Modeling the Choice of Residential Location”, in A. Karlquist et al. (eds), Spatial Interaction Theory and Residential Location, Amsterdam: North-Holland, 75–96.

