A large number of studies have documented the fact that acute air pollution exposure harms human health, even in places where ambient pollution levels are generally low (e.g. Ward 2015, Knittel et al. 2016, Schlenker and Walker 2016, Deryugina et al. 2019). Growing understanding of such harms suggests that further reducing air pollution would substantially improve human health and well-being.
The traditional regulatory approach to improving air quality targets regions with high levels of air pollution. For example, the US Clean Air Act requires “non-attainment” areas that fail to meet minimum air quality standards to take action to reduce pollution, and to achieve “attainment” status as soon as possible. Little is known about the distributional characteristics of the environmental benefits and environmental costs from such an approach, as the work of Hsiang et al. (2018) underscores. Moreover, our understanding of the economics of such policies is changing. For example, research by Bento et al. (2014) found that existing policies are progressive, contradicting the long-held, conventional wisdom that poor communities bear a disproportionate cost of complying with the provisions of the Clean Air Act. It is also not known whether there are alternative targeting approaches that would deliver superior outcomes.
Enhancing our understanding of the distribution of policy benefits and costs is crucial for designing superior environmental regulations.
Considering a new approach
With this in mind, we explore an alternative approach to mitigating harm from air pollution exposure – namely, targeting areas for air quality improvement based on population vulnerability rather than on air pollution levels alone. If places with the populations that are the most vulnerable to pollution are also the places with the worst air quality, then targeting pollution regulations at high-pollution areas is sensible. However, if vulnerable populations tend to live in less polluted areas, then current pollution regulations could be adapted to achieve greater improvements in health. This approach of focusing on vulnerability also highlights an additional avenue for reducing pollution harms – environmental policies could be designed to directly reduce vulnerability to pollution through, for example, improvements in health care infrastructure or healthy behaviours (e.g. diet and exercise), which could reduce the harms of pollution even in the absence of improved air quality.
We examine this issue in the context of a particularly vulnerable population: The US elderly. Specifically, we consider the vulnerability to air pollution among people in the continental US between the ages of 65 and 100 who were enrolled in Medicare, the federal health insurance programme for the elderly. Nearly all (97%) of the over-65 age group in the US are enrolled in the programme.
We look specifically at the mortality risks posed by fine particulate matter (PM2.5) – a mixture of very small particles that are less than 2.5 micrometres in diameter, or about 30 times smaller than the width of a human hair. PM2.5 is generated by burning fuel, such as in power plants and vehicles. It can be carried for hundreds of miles from emission sources and is small enough to be breathed deeply into the lungs. Numerous epidemiological studies have documented a positive correlation between exposure to particulate matter and mortality, especially from cardiovascular disease.
Using detailed information for nearly 15 million US residents aged 65 and over, we examine regional and individual characteristics that may affect vulnerability. Following the methodology of Deryugina et al. (2019), we use machine learning to create a vulnerability index for each individual and explore the geographic, health, and socioeconomic correlates of vulnerability to air pollution exposure.
Wide variation in pattern of vulnerability
We find that vulnerability to PM2.5 among the elderly varies widely across US states and counties as well as across ZIP codes within counties. The highest proportions of vulnerable individuals live in a region that forms something of an L-shape across the continental US, extending south from the Dakotas to Texas and then east along the Gulf Coast States (Figure 1). Large shares of vulnerable elderly also live in eastern Kentucky and West Virginia. The West Coast states have the lowest fraction of vulnerable elderly.
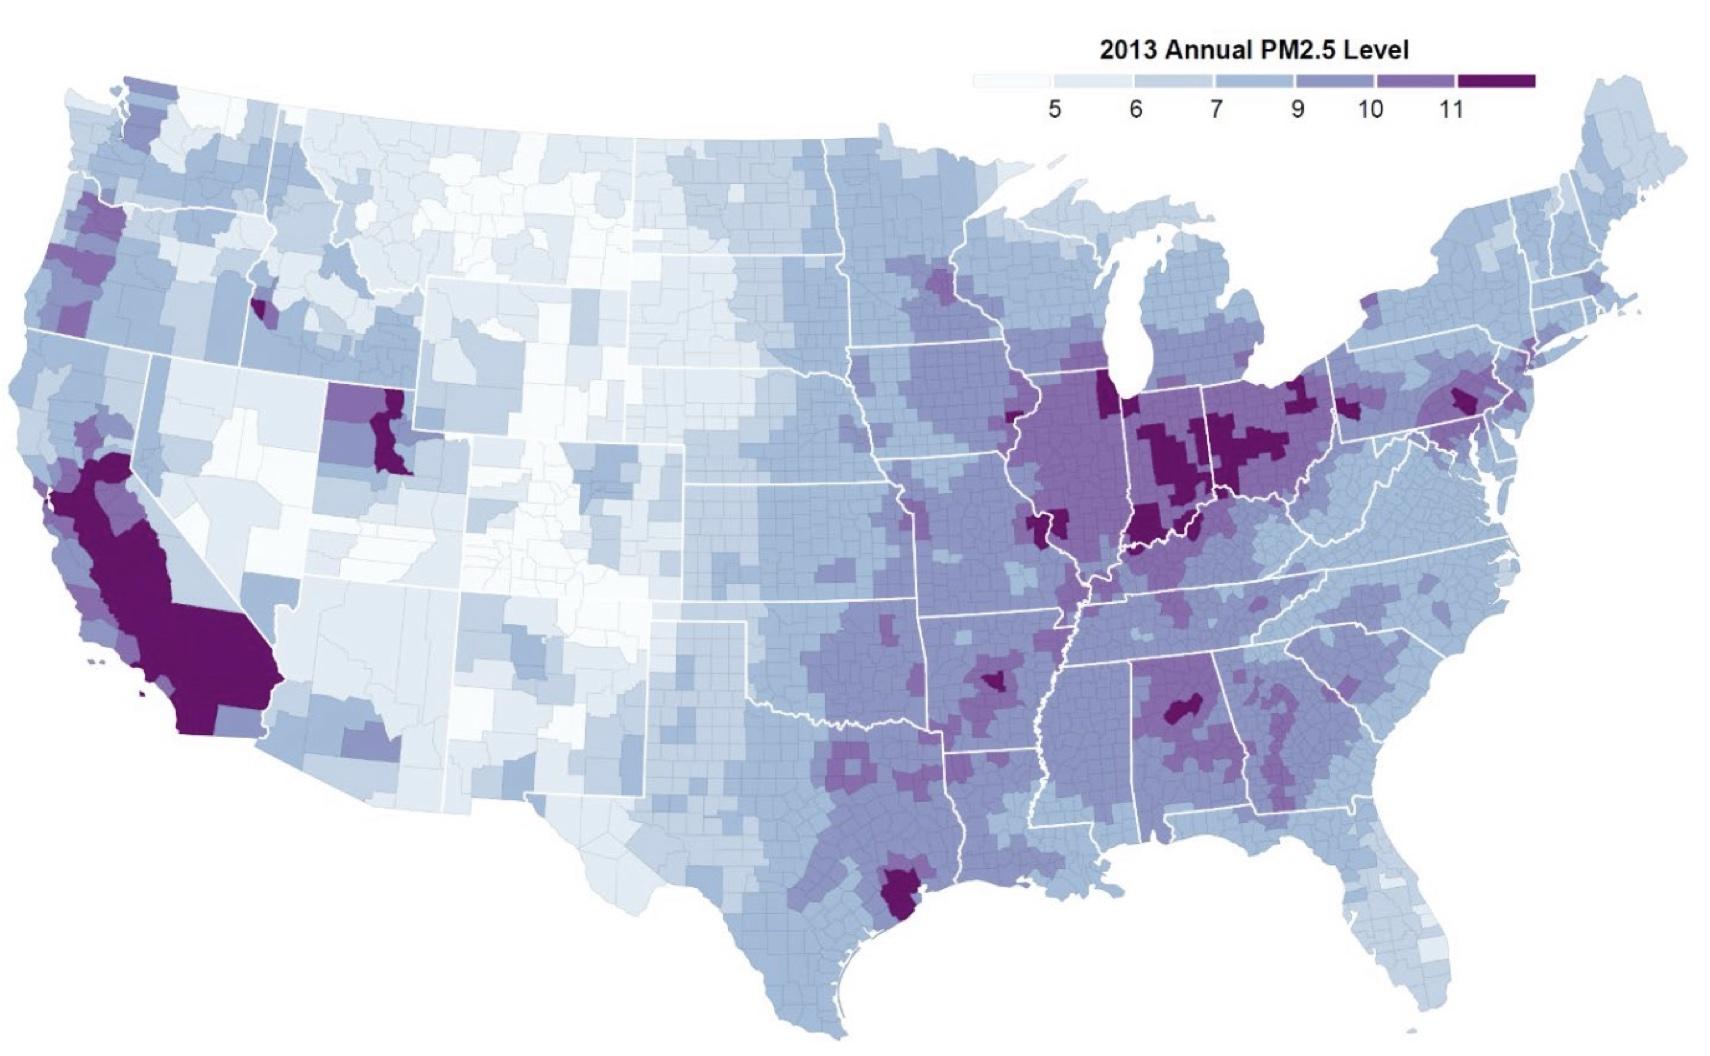
We also find substantial divergence between the geography of vulnerable elderly and the geography of elevated PM2.5 levels. The maps in Figures 1 and 2 illustrate differences in the location of counties that have the highest proportion of vulnerable elderly in the population (Figure 1) and counties that have the highest levels of PM2.5 (Figure 2). A statistical analysis of these patterns reveals that, while average PM2.5 levels are positively related to the prevalence of an array of adverse health conditions, average vulnerability and average PM2.5 levels are negatively related.
Figure 1 Percent of vulnerable beneficiaries
Note: The map shows the fraction of Medicare beneficiaries in each county who were vulnerable to acute PM2.5 exposure (i.e. were in the top 25% of the acute PM2.5 vulnerability index) in 2013.
Source: Deryugina et al. (2020)
Figure 2 Annual PM2.5 levels
Note: The map shows county-level annual PM2.5 levels in 2013. The PM2.5 measure is provided by the US Centers for Disease Control and Prevention National Environmental Public Health Tracking Network, and was created using air pollution monitor data, where available, and modelled estimates for days or counties that do not have monitor data.
Source: Deryugina et. al (2020)
If we consider the total number of vulnerable individuals rather than their share of the population, we obtain a positive correlation between vulnerability and PM 2.5 levels. However, the correlation is far from perfect, implying that targeting the most polluted counties would neglect many vulnerable elderly compared to policies that targeted areas based on vulnerability.
The finding that less-polluted counties tend to have a higher share of vulnerable beneficiaries is notable. There are many possible explanations for this relationship, and our analysis does not isolate the causal effect of average pollution levels on vulnerability. Areas that are less polluted may also have superior medical care facilities that attract frail elderly residents; or those who are vulnerable to air pollution may take care to avoid polluted areas. Indeed, the work of Banzhaf et al. (2019) reviews numerous studies documenting residential sorting on the basis of air pollution. Alternatively, the relationship could be coincidental, with both pollution and vulnerability determined indirectly by population preferences. Regardless of the underlying mechanism, these patterns suggest that there is a trade-off between targeting areas with a high share of vulnerable individuals and targeting areas with high levels of air pollution.
Characteristics linked to vulnerability
Areas with higher proportions of vulnerable individuals are poorer and less urban. They have a higher prevalence of obesity and smoking, higher overall elderly mortality rates, and a lower prevalence of exercise. They also have hotter climates, as measured by the annual number of cooling-degree days. Similar patterns emerge when we consider the total number of vulnerable individuals in a county rather than their share of the population.
Our work also finds, unsurprisingly, that those most vulnerable to pollution have poor health overall. They are more likely to have chronic conditions, such as Alzheimer’s disease or related dementia, chronic obstructive pulmonary diseases (COPD), lung cancer, chronic kidney disease, and congestive heart failure. They use and spend more on health care than those who are less vulnerable.
Although more research is needed to establish causality, these correlations suggest that it is possible to reduce vulnerability to pollution without necessarily reducing pollution levels. For example, programs that target poverty or improve access to health care may also reduce the recipients’ vulnerability to acute pollution exposure. Because pollution levels in the US are already low, and further reductions may be increasingly costly, policies that target vulnerability to air pollution rather than air pollution itself may be more cost-effective.
Rethinking policy approaches
Our study has several limitations. We emphasise that the relationships we document between pollution vulnerability and geographic, health, and socioeconomic characteristics are correlational, not causal. Our work examines just one population group (the elderly). Although substantial evidence shows that elderly people are particularly vulnerable to air pollution, research by Chay and Greenstone (2003) and Knittel et al. (2016) has documented significant effects of air pollution on infant mortality, even in developed countries.
Nevertheless, our work suggests that reducing air pollution in the most polluted areas may be less beneficial than expected because these areas do not necessarily contain the greatest number of vulnerable individuals who stand to benefit from such reductions. Our results cast doubt on the presumption that it is optimal to regulate pollution by targeting pollution-reduction efforts based solely on a region’s baseline pollution level. Emphasising high-pollution areas may fail to direct resources to where the benefit is highest. Moreover, the substantial variation in vulnerability within counties suggests that broad, geographically defined approaches are imprecisely targeted. Our findings suggest that additional attention should be paid to policies that account for local populations’ socioeconomic characteristics such as income, education, and health; local amenities such as hospital quality and capacity; and local environmental characteristics.
Our results also suggest that regulatory policies that operate only by reducing air pollution exposure are inefficient. Policies should include a focus on interventions that reduce overall vulnerability to pollution exposure, whether or not they reduce pollution levels. For example, regulations may be able to cost-effectively reduce vulnerability by improving health care infrastructure, reducing heat exposure, or promoting population health.
References
Banzhaf, S, L Ma and C Timmins (2019), “Environmental Justice: The Economics of Race, Place, and Pollution”, Journal of Economic Perspectives 33(1): 185–208.
Bento, A, M Freedman and C Lang (2015), “Who Benefits from Environmental Regulation? Evidence from the Clean Air Act Amendments”, Review of Economics and Statistics 97(3): 610–622.
Chay, K and M Greenstone (2003), “The Impact of Air Pollution on Infant Mortality: Evidence from Geographic Variation in Pollution Shocks Induced by a Recession”, The Quarterly Journal of Economics 118(3): 1121–1167.
Deryugina, T, G Heutel, N Miller, D Molitor and J Reif (2019), “The Mortality and Medical Costs of Air Pollution: Evidence from Changes in Wind Direction”, American Economic Review 109(12): 4178–4219.
Hsiang, S, P Oliva and R Walker (2019), “The Distribution of Environmental Damages”, Review of Environmental Economics and Policy 13(1): 83–103.
Knittel, C, D Miller and N Sanders (2016), “Caution, Drivers! Children Present: Traffic, Pollution, and Infant Health”, Review of Economics and Statistics 98(2): 350–366.
Schlenker, W and M J Roberts (2009), “Nonlinear Temperature Effects Indicate Severe Damages to US Crop Yields under Climate Change”, Proceedings of the National Academy of Sciences of the United States of America 106(37): 15594–15598.
Ward, C (2015), “It’s an Ill Wind: The Effect of Fine Particulate Air Pollution on Respiratory Hospitalizations”, Canadian Journal of Economics 48(5): 1694–1732.


