World trade is increasingly ruled by preferential trade agreements. Nearly 280 agreements currently in force have been notified to the WTO, and each country in the world participates on average in 14 preferential trade agreements. More are being negotiated, from the Regional Comprehensive Economic Partnership in Australasia, to the Continental Free Trade Area in Africa and the Pacific Alliance in Latin America.
However, the precise content of these agreements remains relatively opaque. Some worry that they deeply distort the pattern of trade by favouring partners over efficient sources (Bhagwati 2008). Others suggest that these agreements are full of political theatre but of limited economic significance (WTO 2011).
In a recent paper (Espitia et al. 2018), we assess a central aspect of these agreements – tariff preferences. Our goal is to see the extent to which parties in the agreements offered their partners better treatment than to those who had been left out. For this purpose, we use a new dataset on preferential and non-preferential applied tariffs, constructed by the International Trade Centre and the World Bank. Non-preferential rates are also referred to as the Most Favoured Nation (MFN) tariff rates which countries promise to impose on imports from other members of the WTO. The dataset covers a total of 5,203 products at the HS6-digit level, 199 reporters and 239 partners, representing approximately 97% of world imports in 2016.
The extent of preferential trade across countries has also been previously estimated by others, including Grether and Olarreaga (1998), Fugazza and Nicita (2010) and Carpenter and Lendle (2011), but in each case the analysis was limited to a sub-sample of countries due to the previously limited availability of data on preferential tariffs.
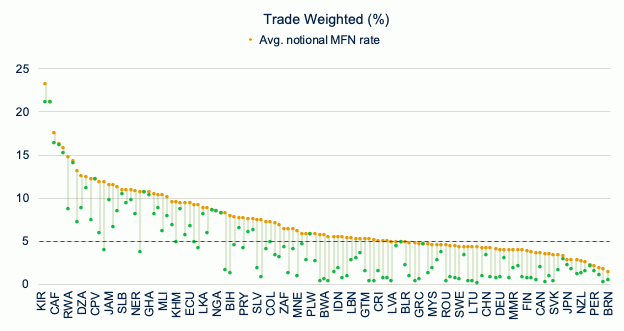
There are three main findings from our analysis. First, preferential trade agreements are not devoid of substance. They now cover more than half of world trade and have significantly widened the scope of tariff-free trade. Whereas 42% of the total value of trade traded freely under MFN rates in 2016, preferential trade agreements have fully liberalised an additional 28% of global trade (Table 1). Furthermore, approximately two-thirds of countries participating in preferential trade agreements have reduced trade-weighted average preferential tariffs to less than 5% (Figure 1).
Table 1 Trade-weighted national MFN and applied tariff rates
Source: Espitia et al. (2018).
Notes: Tariff information is not available for 4% of 2016 global trade from or to unspecified countries.
Figure 1 Preferential liberalisation has reduced trade-weighted average tariffs rates to less than 5% for more than two-thirds of countries
Source: Espitia et al. (2018).
Second, preferential trade agreements have struggled against traditional bastions of protection. Several lower-income countries still have trade-weighted average tariffs well above 5% (Figure 1). And even preferential trade agreements have not been able to eliminate the high levels of protection for a handful of sensitive products that account for 3% of world trade and include agricultural products, textiles, and footwear (Figure 2).
Figure 2 Although preferential liberalisation has targeted highly protected sectors (MFN tariffs greater than 15%), agricultural products, textiles and footwear remain pockets of protection
Source: Espitia et al. (2018).
Third, the widening coverage of preferential trade agreements is in itself an antidote to trade diversion. The average preferential margin – the difference between the MFN rate of duty and the preferential rate for members of preferential trade agreements – for trade covered by preferential trade agreements is low because one-fifth of world trade under preferential agreements is already duty-free. Still, on the face of it, more than a quarter of world trade is subject to an average preference margin of 7.4%.
However, given the proliferation of preferential trade agreements, the advantage conferred by a preferential tariff to a given exporter does not depend only on the difference between the MFN tariff and the preferential rate, but also on the tariffs faced by competing suppliers from other countries in the same market. Competition-adjusted preference margins are calculated as the percentage point difference between the weighted average tariff rate applied to the rest of the world and the preferential rate applied to the beneficiary country, where weights are represented by trade shares in the preference granting market. Unlike a traditional preference margin, a competition-adjusted preference margin can assume positive as well as negative values. A negative value indicates that, in a specific market, a certain country faces worse market conditions than its trade competitors.
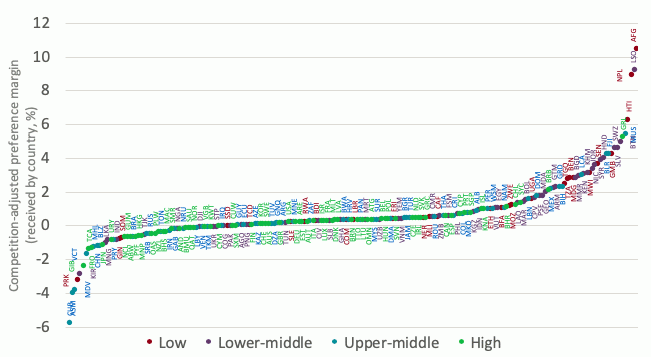
Once we consider competition from both preferential and non-preferential sources – because trade rivals often belong to the same preferential trade agreements, only about 5% of global exports benefited from a preferential advantage of over 5% and only 3.3% of global exports suffered from a preferential disadvantage higher than 5%. Nepal, Lesotho, and Afghanistan, for example, receive positive preferential margins of 8.9, 9.2 and 10.5%, respectively, whereas a few countries, including Cuba, American Samoa and the Maldives, pay tariffs of 4% higher on their exports than the competition adjusted levels.
Figure 3 Lower-income countries tend to benefit the most in terms of competition-adjusted margins
Source: Espitia et al. (2018).
These findings are based on potentially applied tariffs. In practice, preferential duties are not granted automatically to all potentially eligible products. An assessment of the scope of preference utilisation for the sub-sample of EU imports from its trading partners suggests that the rate of utilisation of preferences varies across countries and products, depending on impediments such as restrictive rules of origin. Therefore, actual preference margins are generally lower than potential margins.
The stylised facts on the patterns and extent of preferential liberalisation presented here can provide the basis for a future research agenda on the implications and determinants of preferential tariffs. The relatively small extent of preference margins also suggests motives for preferential trade agreements beyond purely preferential tariffs. These other dimensions of preferential trade agreements are included in a forthcoming International Trade Centre-World Bank database.
References
Bhagwati, J (2008), Termites in the trading system: How preferential agreements undermine free trade, Oxford: Oxford University Press.
Carpenter, T and A Lendle (2010), “How preferential is world trade?”, Graduate Institute Centre for Trade and Economic Integration working paper 2010-32.
Espitia, A, A Mattoo, M Mimouni, X Pichot and N Rocha (2018), “How preferential is preferential trade?”, World Bank Policy Research working paper 8446.
Fugazza, M and A Nicita (2010), “The value of preferential market access”, UNCTAD Blue Series on Policy Issues in International Trade and Commodities.
Grether, J-M and M Olarreaga (1998), “Preferential and non-preferential trade flows in world trade”, World Trade Organisation Staff working paper 10/1998.
World Trade Organisation (2011), World Trade Report 2011. The WTO and preferential trade agreements: From co-existence to coherence.


