The Global Crisis brought attention to connections among financial institutions, in particular whether they make systems more prone to crises, how they do so, and what spillovers they may have to the macroeconomy. Researchers have responded by producing new theoretical models to explain how linkages might propagate risk (Acemoglu et al. 2015), developing an array of measures to help policymakers evaluate systemic risk and testing them on data before, during, and after the Global Crisis (see the review article by Bisias et al. 2012), and showing how interbank relationships can amplify economic downturns (Mitchener and Richardson 2019).
An exciting current area of research aims to improve our understanding of systemic risk and its relation to crises by examining earlier eras. One approach has been to apply existing systemic risk measures and ‘backtest’ them on earlier crises. For example, Brownlees et al. (2015) use a sample of 126 New York Clearing House banks over the period 1865–1925 to analyse the utility of two popular systemic risk measures – Srisk and CoVaR.
Another promising avenue is to provide a comprehensive examination of systemic risk for a particularly important crisis from the past, exploiting differences in network structure as well as the variation in severity and geographical impact to shed light on systemic risk measurement. Along these lines, our new study (Das et al. 2018) examines the most severe US banking crisis of the 20th century, namely, the Great Depression, which saw approximately 9,000 commercial banks fail. We develop tools to examine where risk was concentrated and how exposed the entire commercial banking network was to risk before the decline in economic activity and the onset of the first banking crisis, and how the network structure was altered by the massive number of failures during 1929–33. Importantly, because our measures are bank-specific and we have data on the outcomes of every commercial bank in the system, we are able to both test whether our systemic risk measures improve prediction of subsequent failure and identify precisely how they affected bank survival.
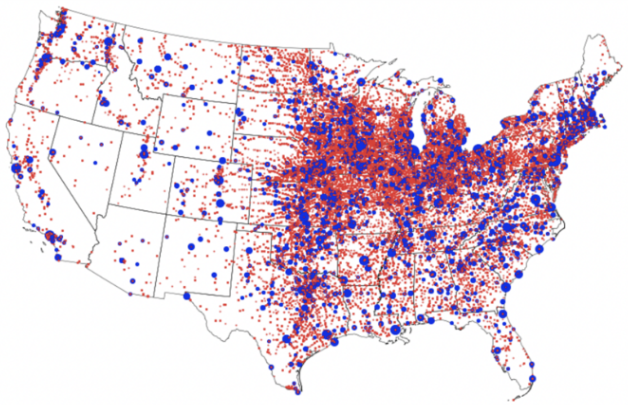
Our approach has several novel features that allow us to provide new insights into systemic-risk assessment as well as how interbank relationships mattered during this largest American banking crisis of the 20th century. We construct network measures using a new data set of correspondent banking relationships for all commercial banks and trusts in the US in 1929 and 1934. More than 25,000 banks were connected in 1929 (Figure 1), and there were over 70,000 unique connections between banks.
Figure 1 Correspondent and respondent banks in 1929 (top) and 1934 (bottom)
Note: Respondent banks are pictured in red and correspondent banks in blue, sized by relative degree of each bank. Respondent banks place money with correspondent banks. Correspondents were often large banks, located in city centres. The correspondent-respondent relationship arose during the 19th century out of the need to service the demands of customers wanting to do business in more distant locations. Regulations that enabled smaller banks to satisfy reserve requirements by holding interbank deposits in larger banks further cemented these relationships and created a pyramid-shaped network, with banks in the largest cities (New York and Chicago) sitting at the top of the pyramid.
In contrast to recent approaches that estimate financial linkages from financial flow data, our measures of connectedness are based on stated correspondent relationships for all commercial banks in the US for these two years. That is, unlike many measures developed for the Global Crisis, where the connections themselves need to be estimated or the systemic risk measure is an estimate based on predictions from regressions, our measures of connectivity and systemic risk are constructed from raw relationship data, hand-collected from bankers’ directories. This feature of our data is advantageous in terms of network modelling (the data permit the direct measurement of nodes and connections between them), as well as prediction (no need to account for additional layers of uncertainty in empirically estimating individual bank outcomes).
Following Das (2016), our systemic risk measure combines internal credit risk stemming from the balance sheet and external bank risk stemming from the network connections. Since credit ratings were non-existent for the tens of thousands of banks that were too small to be listed on the New York Stock Exchange, we employ financial ratios to develop a composite measure of credit risk, a product of inverse profitability and transformed leverage. The functional form of the combined internal-external systemic risk measure can be decomposed, so we can observe the contribution to overall systemic risk by each individual bank.
Understanding which nodes have the greatest influence in the network – i.e. which nodes are the most critical – is of particular interest to policymakers who might want to identify institutions that are ‘too big to fail’ or systemically important. We show that systemic risk was fairly dispersed in 1929, with the top 20 banks contributing roughly 18% of total systemic risk. The top two contributors to systemic risk, Continental Illinois National Bank and Trust Company and Chase National Bank, combined had over 7,000 unique bank relationships. In 1934, as a result of the massive banking crisis of the early 1930s, the average number of connections between banks decreased and average balance sheet risk increased. The combination of these two changes reshaped the network and redistributed risk – it raised systemic risk per bank by 33% and increased the riskiness of the 20 largest banks in the system by five percentage points. The distribution of risk thus became more concentrated at the top of the system.
In addition, we assess whether network topology matters for risk, in particular whether the pyramid-like structure of the banking system that existed prior to the Great Depression concentrated risk (see note to Figure 1). We show that, even within the class of ‘scale-free’ networks, a particular topology can amplify risk. Relative to a ‘random scale-free graph’ topology, the pyramid-like structure of the commercial banking system that existed in 1929 increased fragility and the propensity for risk to spread by concentrating banking interactions to particular nodes in the network.
Developing systemic risk measures that help to pinpoint distress and predict subsequent financial institution failure is a central goal of policymakers. Using individual data on all US commercial banks, we are able to test directly whether systemic risk measures, such as the ones developed in our research, are useful predictors of subsequent banking distress – that is, whether models incorporating systemic risk outperform those that do not – and whether specific network features increased or lowered survivability. Using marginal likelihood computations, we show that when network measures such as eigenvector centrality and a bank’s systemic risk contribution are combined with balance sheet data that capture ex ante bank default risk, they strongly predict bank survivorship in 1934. The model that includes network measures is better supported by the data than a model without network measures, suggesting network-based systemic risk measures may have considerable utility for policymakers wanting to understand where risk lies in the system and the implications of that risk for bank distress.
We show that banks with higher ex ante default risk in 1929 were more likely to subsequently fail. We also find that the effects of a bank’s connectivity depended on whether it was a member of the Federal Reserve System. For most banks in the system, the combination of a risky balance sheet and high-connectivity led to a higher probability of bank failure. However, Federal Reserve members do not seem to experience these same negative effects – a particularly interesting result in light of the fact that, beginning in 1932, the Reconstruction Finance Corporation carried out a large-scale intervention to rescue some banks. Comments by the chief administrator of the Reconstruction Finance Corporation suggest that they were particularly keen on providing support to that nation’s largest banks (Jones 1951), most of which were well-connected Federal Reserve member banks. These results thus support the view that the wellspring of America’s ‘too big to fail’ banking policy dates to a much earlier era.
Our research reinforces another point emerging from the recent Global Crisis: large macro shocks may have different effects on the financial system, depending upon the structure of network connections. Brunetti et al. (2017) analyse the interbank market around 2008 and find that physical or stated network connectivity provides meaningful forecasts of subsequent liquidity problems. Our analysis of the Great Depression, which also uses stated relationships to examine bank survivorship, complements these findings. During the banking panics of the 1930s, demand for liquidity soared. Smaller and medium-sized banks, which were unable to procure liquidity, often failed.
The uniqueness of the network topology during the Great Depression and the vast geographical dispersion of bank failures offer new insights into the analysis of systemic risk during crises, especially as the number of financial institutions in the Great Depression was far higher than that which exists in recent times. The nature and antecedents of economic crises may change over decades, but the value of network analysis in measuring and predicting systemic risk and its fallout remains robust across time.
References
Acemoglu, D, A Ozdaglar and A Tahbaz-Salehi (2015), “Systemic risk and stability in financial networks”, American Economic Review 105(2): 564–608.
Bisias, D, M Flood, A Lo and S Valavanis (2012), “A survey of systemic risk analytics”, Annual Review of Financial Economics 4: 255-96.
Brownlees, C, B Chabot, E Ghysels and C Kurz (2015), “Backtesting systemic risk measures during historical bank runs”, Federal Reserve Bank of Chicago Working Paper 2105-09.
Brunetti, C, J Harris, S Mankad and G Michailidis (2017), “Interconnectedness in the inter-bank market”, Journal of Financial Economics, forthcoming.
Das, S (2016), “Matrix metrics: Network-based systemic risk scoring”, The Journal of Alternative Investments 18: 33-51.
Das, S, KJ Mitchener and A Vossmeyer (2018), “Systemic risk and the Great Depression”, CEPR Discussion Paper 25405.
Jones, JH (1951), Fifty billion dollars: My thirteen years with the RFC, 1932-1945, New York: Macmillan.
Mitchener, KJ, and G Richardson (2019), “Network contagion and interbank amplification during the Great Depression”, Journal of Political Economy, forthcoming.


