Traditionally, the Gross Domestic Product is the most widely accepted indicator of an economy’s size and performance, although in the last decades many contributions have suggested to adopt alternative tools to measure people’s wellbeing (see Stiglitz, Sen, and Fitoussi 2008).
The Gross National Income (GNI) is largely considered a better indicator to account for the income available to the dwellers of a country because it captures the incomes related to the mobility of factors of production (wages earned by cross-border workers, repatriated profits and dividends, etc.), the so-called Net Primary Incomes (NPI), in the Systems of National Accounts (see UN 2008 and IMF 2009).
However, GNI does not include unilateral transfers such as foreign aid and, most importantly, remittances: the so called Net Secondary Incomes (NSI). GNI accounts for the income of cross-border workers – the so called compensation of employees – but not for the money sent home by those who live and work abroad for more than one year, which are by far the largest share of remittances. Remittances have increased by approximately seven times between 1990 and 2010 (see the World Bank database); they now represent one of the largest types of monetary inflows for many developing countries and in some developing countries they can be as high as 20% of GDP.
Unilateral transfers are recorded by a third indicator, the Gross National Disposable Income (GNDI), which includes both primary and secondary distribution of income. GNDI provides a much better indicator than the GNI of the living standard of the people of a country and in many cases it should substitute for the latter measure.
However the GNDI is not easily available in major international reports and databases. The OECD calculates GNDI for its members and for some non-member countries such as China and Indonesia. Furthermore, GNDI is sometimes confused with GNI in common practice (see for instance Todaro and Smith 2011, page 54).
GDP, GNI, GNDI in figures
In countries were remittances play an important role, the GNDI is significantly larger than both the GDP and the GNI.
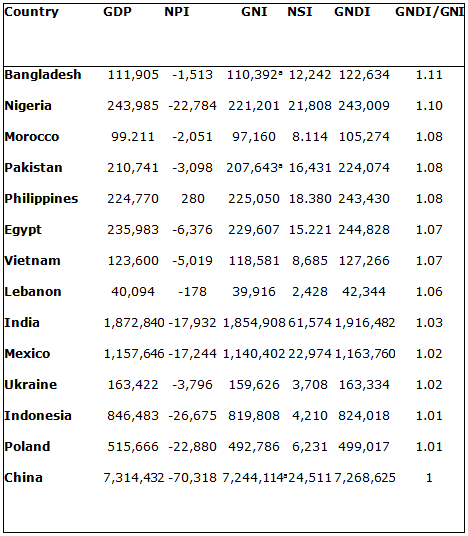
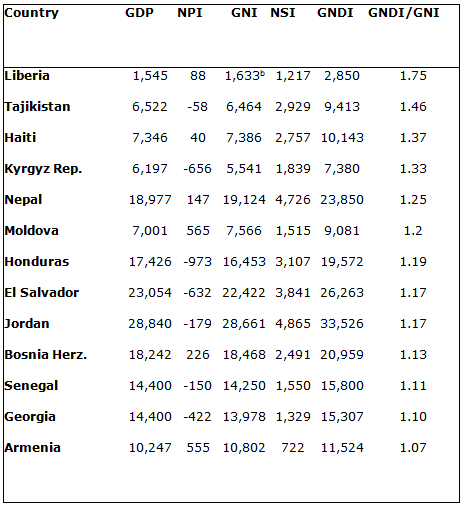
Tables 1 and 2 show the figures for the three indicators with regard to 27 developing countries for which remittances are particularly important, either in absolute or relative terms. Data – all in current USD – on GDP, NPI, and NSI come from the World Bank Database. Following the 2008 System of National Accounts and the 2009 version of the IMF Balance of Payments, GNI and GNDI are calculated as, respectively, GDP + NPI and GDP + NPI + NSI. A similar table with all the countries in the World Bank database is available from the authors.
All the countries in Table 1 are among the top twenty receivers of remittances in absolute terms in 2011.
Table 1. Countries among top remittances receivers, absolute terms (Millions of US$, 2011)
Source: World Bank Database.
a For these economies, the datum on GNI as provided by the World Bank Database is different from the sum of GDP and NPI.
Table 2 provides the same kind of figures for the countries that in 2011 were amongst those with the highest share of remittances received as a percentage of GDP.
Table 2. Countries among top remittance receivers, relative terms (Millions of US$, 2011)
Source: World Bank Database.
b For this economy, the datum on GNI as provided by the World Bank Database is different from the sum of GDP and NPI.
A few considerations emerge from the two tables:
- First, the GDP and the GNI are not markedly different for either group of countries, but a striking difference arises with the GNDI, in particular for countries in Table 2: from 7% for Armenia to 75% for Liberia to 46% for Tajikistan. Most of the countries in Table 2 have both a small economy and a small population. This is not the case for Nepal, whose population exceeds 27 million and where GNDI is 25% higher than GNI. Some large countries in Table 1 have a GNDI around 10% larger than GNI. Pakistan and Bangladesh have a population of more than 150 million people and the Philippines almost 100 million. The net secondary income is clearly extremely important.
- Second, for all the countries in Table 2 the magnitude of net unilateral transfers is far higher than that of net primary income. The same is true for a number of countries in Table 1, namely Bangladesh, Egypt, India, Lebanon, Pakistan, and the Philippines.
- Third, the balances of primary and secondary incomes are quite different; due to a negative NPI in many countries, GNI is smaller than GDP, contrary to common perception. With the exception of the Philippines, the Net Primary Income is negative for all countries of Table 1. Such outflows of income are mainly due to dividends and distributed profits paid to foreign companies that have invested in the countries. In many developing countries a positive Net Secondary Balance compensates for the negative sign of the Primary Income one. India, Vietnam, Mexico, China represent in this sense very remarkable examples. In the case of Nigeria and Poland, the negative NPI is so large that the positive NSI cannot compensate for it and the GNDI is lower than the GDP.
Some possible domains to use the GNDI
Of course switching from GNI to GNDI will not make Nepal a high income country, but it will give a better picture of her people’s actual purchasing power.
Let us see some examples where the GNDI should replace the GNI as the main indicator for living standards.
- In 2010 the GNI substituted for the GDP – both per capita and at Purchasing Power Parities – in order to calculate the dimension of the living standards, one of the three sub-indexes on which the Human Development Index is built. This change was meant to provide a better approximation of the income actually available to a country’s residents (see Kovacevic 2010). However, the GNDI may prove more informative in this respect, as remittances and other transfers can hardly be neglected when the focus is on people’s command over goods and services.
- The World Bank classifies the countries according to thresholds based on the GNI per capita (World Atlas method). The adoption of GNDI would lead to minor changes, but if the aim is to assess the living conditions of a population, GNDI should be adopted. If the thresholds are used to describe the productive strength of an economy, then GDP could prove a better tool.
- The choice of the income indicator does not directly affect the international poverty line of 1.25 USD a day (2005 PPP prices), which is based on consumption surveys. Yet, it is clear that the income actually available to the households influences their expenditure pattern (see Adams and Page 2003).
- Finally, many developing countries have a chronically negative trade balance This is the case for all countries in Table 2 and for all but China, Indonesia and Nigeria in Table 1. Yet apart from these three countries (plus Poland and Ukraine), the Current Account Balance is much better than the trade one. The most notable case is that of Nepal, which moves from a negative Trade Balance of 23% of GDP to a positive 1.5% Current Account Balance. However, thanks to the surpluses in the secondary income balances, which is captured by GNDI, they can partially offset the trade deficit.
Conclusion
The figures show that for countries with large numbers of migrants (not just cross-border workers) with respect to their population, the GNDI is a much better indicator than GNI of the value of all the incomes transferred from the rest of the world and available to the households of a country for their consumption and savings.
References
Adams, R H, and J Page (2003), “Poverty, Inequality and Growth in Selected Middle East and North Africa Countries”, 1980-2000 World Development, vol. 31, n. 12.
Kovacevic, M (2010), “Review of HDI Critiques and Potential Improvements”, UNDP Human Development Research Paper, 33.
IMF (2009), Balance of Payments Manual, Sixth Edition.
Stiglitz J, A Sen and J P Fitoussi (2008), Report by the Commission on the Measurement of Economic Performance and Social Progress.
Todaro, M and S Smith (2011), Development Economics, Pearson: Boston. Eleventh Edition.
UN (2008), Systems of National Accounts.


