It is often said that a picture is worth a thousand words. The raising of the American flag over Iwo Jima. The lone man standing before the line of tanks in Tiananmen Square. The naked girl fleeing her burnt village during the Vietnam War. The celebratory kiss between a sailor and a nurse in Times Square at the end of WWII. These iconic pictures continue to shape public perceptions of major historical events. Put simply, visual information is more memorable and persuasive than textual information (Sullivan and Masters 1988, Graber 1990, Graber 1996).
Over the past several decades, the quantity of images we are exposed to each day has increased with the rise of television, the internet, and social media. Our perception of many events is shaped by a single snapshot or a quick clip rather than a detailed written analysis. Despite the emphasis the human brain places on visual information, and the growing importance of images in news consumption, the literature on media bias has focused primarily on text-based measures (e.g. Groseclose and Milyo 2005, Gentzkow and Shapiro 2010, Martin and Yurukoglu 2017, Principe and van Ours 2021).
To address this gap in our understanding, I construct a dataset of nearly one million image files used during the 2016 election cycle (Boxell 2021a). Using computer vision tools, I extract nearly 80,000 faces of 61 politicians used across 92 websites. For each face, I use the Microsoft Emotion application programming interface (API) to characterise the emotional content expressed (happiness, anger, fear, surprise, disgust, contempt, sadness, or neutral) and examine how these expressions correlate with the partisanship of a website’s users.
There are two main ways that media bias can present itself in images: bias in who to cover and bias in how to cover. I find evidence of significant partisan media bias along both dimensions.
Bias in who to cover
To detect who is covered in each face, I train a facial recognition algorithm using the Microsoft Face API and manually labelled images of each politician. The trained algorithm is then applied to the dataset of unlabelled images. If conservative and liberal websites cover the same politician at different rates, that would be evidence of media bias in who to cover. To assign the ideology of each website, I use the Berkman-Klein partisanship scores (Faris et al. 2017), which are based on the relative frequency of Twitter shares by followers of Donald Trump and Hillary Clinton.
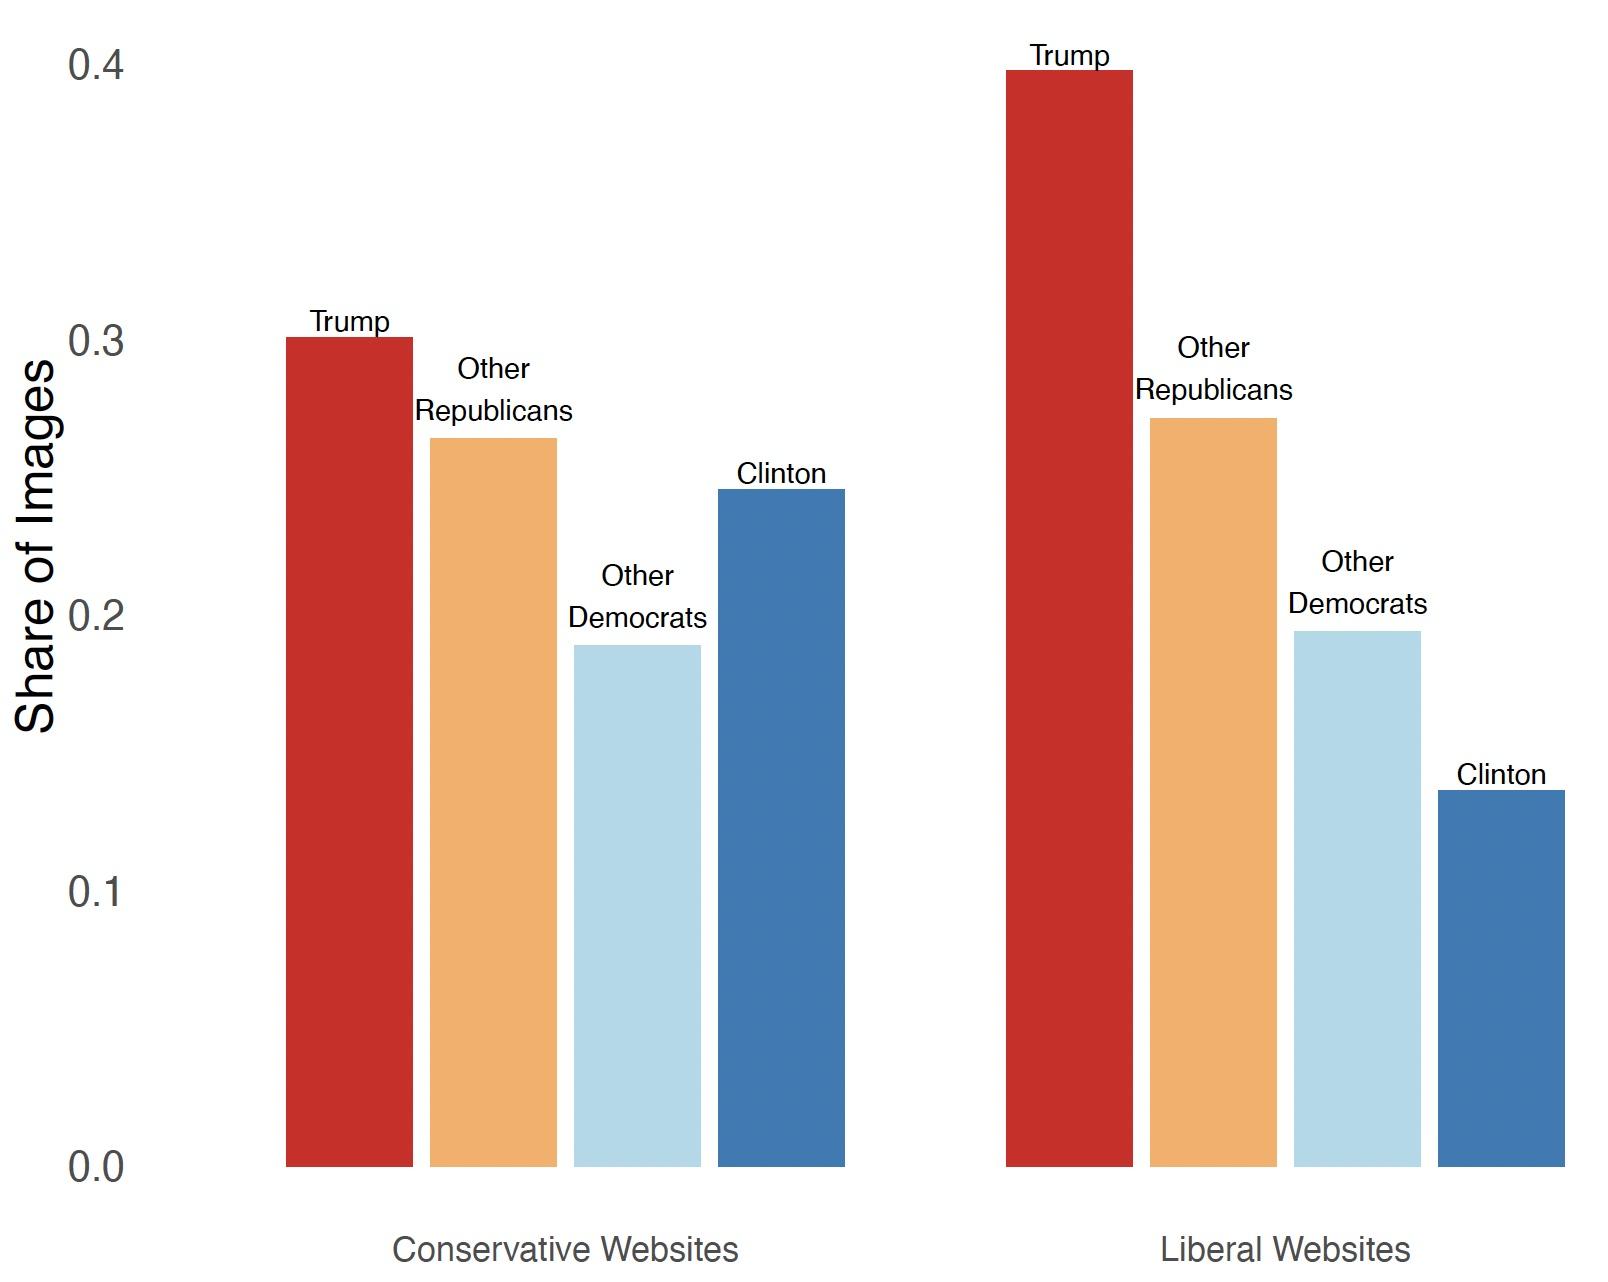
Figure 1 shows the share of images (or faces) for each set of politicians. Trump received more coverage than any other politician, and this holds true for both conservative and liberal websites. However, a clear pattern also emerges: liberal websites focused on Trump and other Republicans relatively more than conservative websites, while conservative websites gave more coverage to Clinton and other Democratic politicians. These results are consistent with previous work showing that Trump received a disproportionate amount of coverage, and that partisan news outlets tend to cover the opposing side more (Budak et al. 2016, Patterson 2016a, 2016b).
Figure 1 Bias in who to cover
Source: Boxell (2021a, Panel A of Figure 2)
When did Trump start receiving so much coverage?
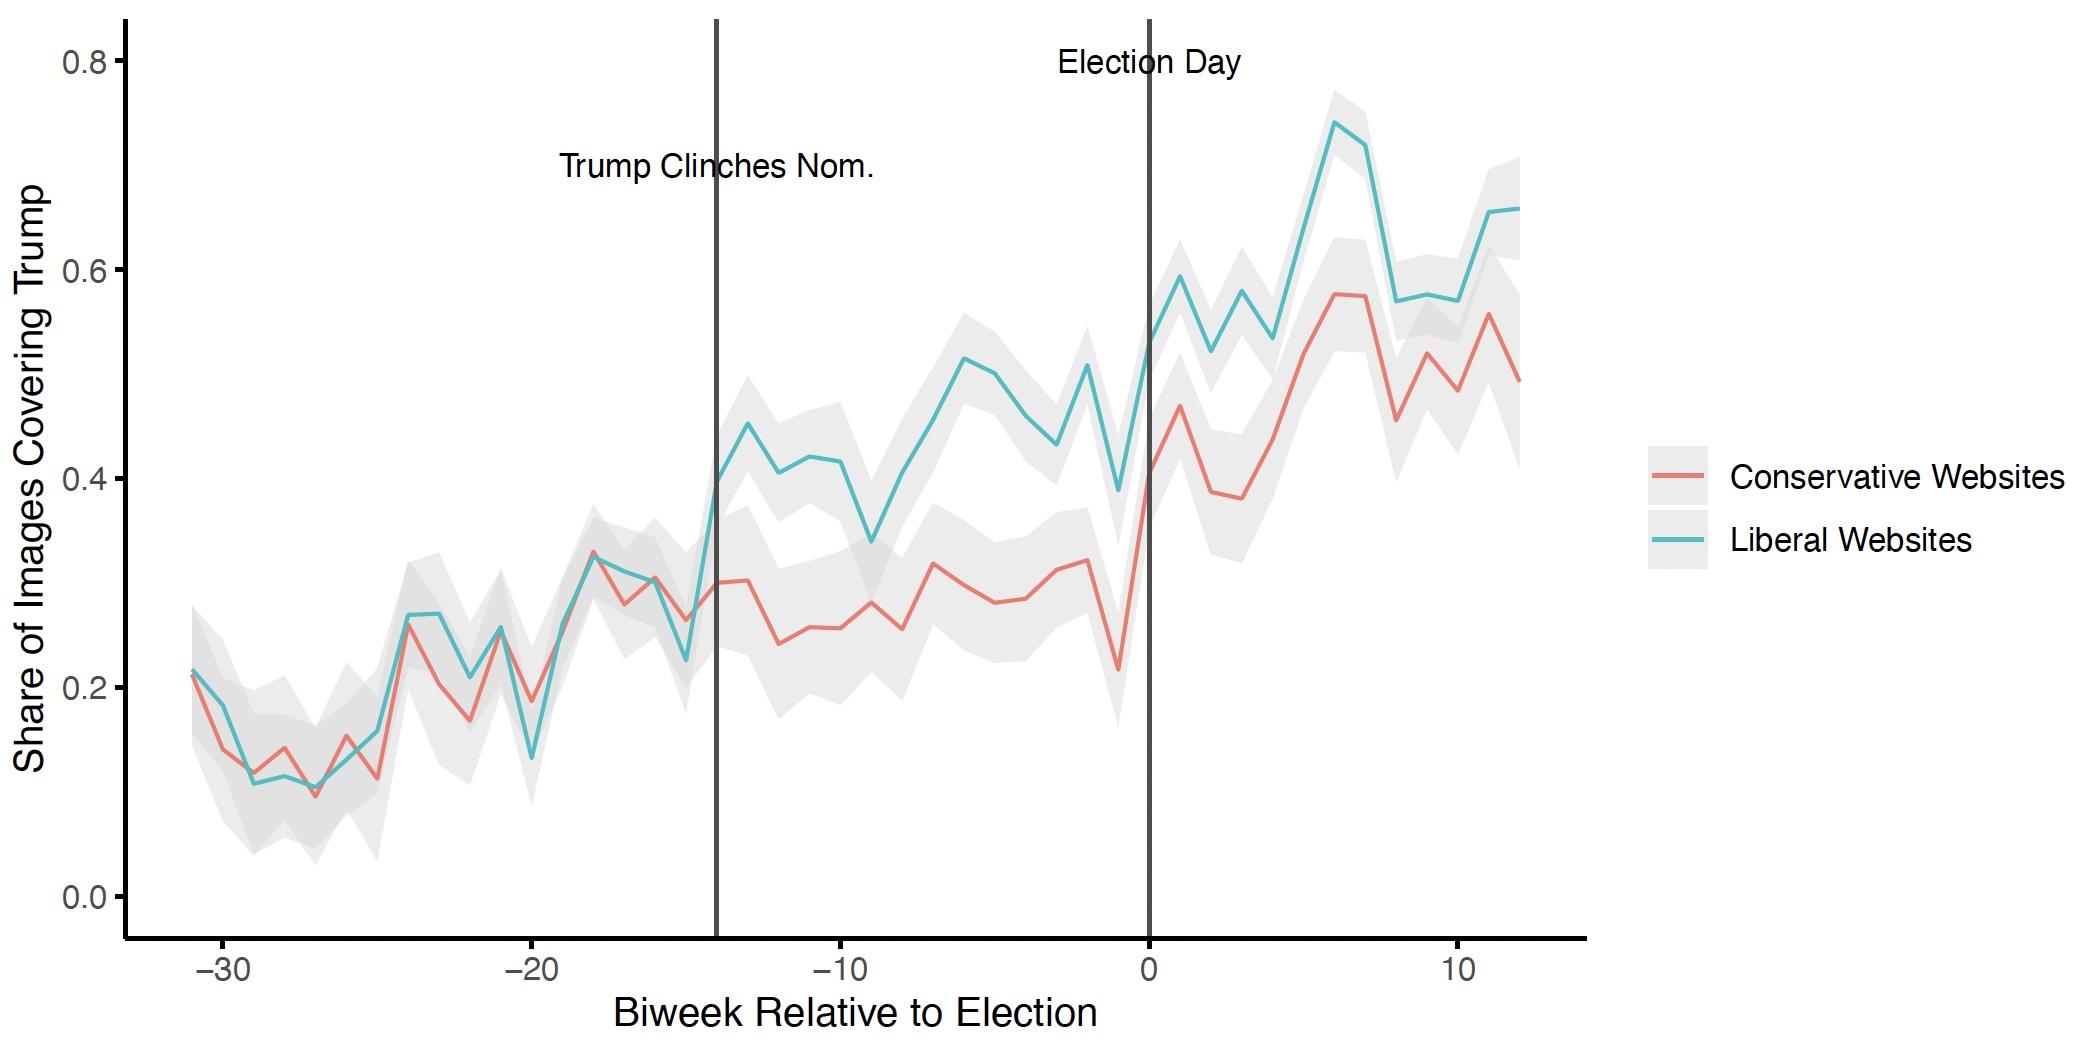
Figure 2 shows the share of images covering Trump, averaged across conservative and liberal websites for each bi-week relative to the election. During the primaries, both conservative and liberal websites covered Trump at an equal rate: roughly 20% of images. However, as soon as Trump clinched the Republican nomination, the amount of coverage devoted to him by liberal websites increased by roughly 50%. There was no corresponding increase in coverage of Trump by conservative websites. Similar results are observed for Clinton, with conservative websites increasing coverage of her as she emerged as the dominant candidate and eventual nominee (Boxell 2021a).
Figure 2 Trends in coverage of Trump across election period
Source: Boxell 2021a (Panel A of Figure 4)
Bias in how to cover
In addition to the choice of who to cover, news outlets can also choose the exact image used to portray a candidate. In political contests, a candidate’s image is crucial. Images of politicians influence voters’ perceptions and opinions (Rosenberg and McCafferty 1987, Sullivan and Masters 1988, Rosenberg et al. 1991, Barrett and Barrington 2005, Stewart et al. 2009), and facial expressions can be readily sorted by news professionals choosing more or less flattering snapshots of a given event.
To determine the relative favourability of each image, I measure the facial emotions expressed using the Microsoft Face API. This API predicts the likelihood that a given image is displaying each emotion (happiness, anger, fear, surprise, disgust, contempt, sadness, or neutral). Hu and Ma (2021) use similar machine-learning tools to examine how entrepreneurs persuade investors.
Figure 3 shows the average emotion score (on a scale of 0 to 100) across candidate and website groupings for happiness and the sum of all negative emotions (anger, fear, surprise, disgust, contempt, and sadness). Media bias in how to cover candidates exists when there is a difference in how conservative and liberal media outlets portray the same candidate. Liberal websites were more likely than conservative websites to portray Clinton as happy, whereas conservative websites were more likely to choose images portraying Clinton with negative emotions. Similar but less stark differences exist for the other politician groupings.
Figure 3 Bias in how to cover
Source: Boxell (2021a, Panel B of Figure 2)
Figure 4 examines the relationship between the difference in ‘relative favourability’ (happiness minus the sum of negative emotions) for Trump and Clinton (y-axis) versus the partisanship of each website’s users (x-axis). There is a strong, positive relationship between having more conservative website users and portraying Trump with relatively more positive emotions than Clinton. To put the magnitudes in context, when analysed at the image level, going from equal user partisanship (e.g. The Wall Street Journal) to a homogenous user group (e.g. Breitbart or Daily Kos) is correlated with a two-third standard deviation shift in nonverbal slant.
Figure 4 Average favourability towards Trump vs Clinton
Source: Boxell (2021a, Panel B of Figure 3)
Conclusions
News outlets engage in partisan media bias by selecting who to cover and how to cover them. Conservative websites portray liberal candidates more frequently and with relatively more negative emotions than liberal websites, and vice-versa. The extent of media bias also varies across the election cycle in response to electoral incentives; in particular, when switching from the primaries to the general election. Overall, these results provide new evidence on nonverbal media bias in general, along with an improved understanding of media bias during the 2016 election in particular. Future work should continue to examine the effects of nonverbal media bias on outcomes, such as political polarisation (Boxell 2017, Boxell 2021b).
References
Barrett, A W and L W Barrington (2005b), “Is a picture worth a thousand words? Newspaper photographs and voter evaluations of political candidates”, The International Journal of Press/Politics, 10(4):98–113.
Boxell, L (2017), “The internet, social media, and political polarisation”, VoxEU.org, 01 October.
Boxell, L (2021a), “Slanted images: Measuring nonverbal media bias during the 2016 election”, Political Science Research and Methods, conditionally accepted.
Boxell, L (2021b), “Drivers of US political polarisation: Three stylized facts and their implications,” VoxEU.org, 25 August.
Budak, C, S Goel and J M Rao (2016), “Fair and balanced? Quantifying media bias through crowdsourced content analysis”, Public Opinion Quarterly, 80(S1): 250–271.
Faris, R M, H Roberts, B Etling, N Bourassa, E Zuckerman and Y Benkler (2017), “Partisanship, propaganda, and disinformation: Online media and the 2016 U.S. presidential election”, Berkman Klein Center for Internet & Society Research Paper.
Gentzkow, M and J M Shapiro (2010), “What drives media slant? Evidence from U.S. daily newspapers”, Econometrica, 78(1):35–71.
Graber, D A (1990), “Seeing is remembering: How visuals contribute to learning from television news”, Journal of Communication, 40(3):134–156.
Graber, D A (1996), “Say it with pictures”, The ANNALS of the American Academy of Political and Social Science, 546(1):85–96.
Groseclose, T and J Milyo (2005), “A measure of media bias”, Quarterly Journal of Economics, 70(4): 1191–1237.
Hu, A and S Ma (2021), “Persuading investors: A video-based study”, VoxEU.org, 21 August.
Martin, G J and A Yurukoglu (2017), “Bias in cable news: Persuasion and polarization”, American Economic Review, 107(9):2565–2599.
Patterson, T E (2016a), “News coverage of the 2016 general election: How the press failed the voters”, Working Paper.
Patterson, T E (2016b), “Pre-primary news coverage of the 2016 presidential race: Trump’s rise, Sanders’ emergence, Clinton’s struggle”, Working Paper.
Principe, F and J van Ours (2021), “Racial bias in newspaper ratings of professional football players”, VoxEU.org, 22 August.
Rosenberg, S W and P McCafferty (1987), “The image and the vote manipulating voter’s preferences”, Public Opinion Quarterly, 51(1):31–47.
Rosenberg, S W, S Kahn, T Tran and M-T Le (1991), “Creating a political image: Shaping appearance and manipulating the vote”, Political Behavior, 13(4):345–367.
Stewart, P A, B M Walker and J N Schubert (2009), “Presidential speechmaking style: Emotional response to micro-expressions of facial affect”, Motivation and Emotion, 33:125–135.
Sullivan, D G and R D Masters (1988), “‘Happy Warriors’: Leaders’ facial displays, viewers’ emotions, and political support”, American Journal of Political Science, 32(2):345–368.
