Recent trends in trade have invited a mix of consternation and hyperbole in the business and economics press and blogosphere alike. Discussion has ranged from worries about export credit shortfalls to resurgent protectionism. The focus has been on finding the cause, and some have assumed that the collapse in trade is unprecedented, inconsistent with the general level of economic downturn, and indicative of a trade-related set of problems calling for trade-specific solutions. There are indeed important public policy questions here. Is this recession being confounded by a set of trade-specific problems and issues? If so, how big is the effect and should we be worried?
In confronting these questions, we need to be careful when comparing real and nominal changes in trade. The last 12 months have seen a dramatic drop in commodity prices, so that real and nominal trade data can tell a very different story. In addition, because the importance of various sectors in trade varies from their importance in GDP and also varies considerably across countries, we also need to pay close attention to how we deflate trade flows to control for falling prices across a range of commodities. We also need to examine what is happening to domestic production before deciding we have a mismatch between trade and GDP trends.
Dropping global trade
Global trade plummeted in the last months of 2008. Indeed, world trade volumes fell 14% from December 2008 to February 2009. (This is somewhat better than the November-January drop of 18%, in part reflecting a 0.8% rise in February.) In the three months ending in February, Japanese exports were down 29%. EU15 exports were up 0.3% in February over January levels, after falling 2.3% in December and 5.3% in January (CPB World Trade Monitor, 21 April 2009). The projections for the full year 2009 offer little comfort. The WTO has forecast a 9% decline in global export volumes for 2009.
When digesting this information, the arcane question of appropriate price deflators is important. Real trade figures can vary substantially according to the underlying price indices used to deflate the data. The recent, highly cited WTO figures rely on world GDP prices, but there are problems with this approach.
GDP includes a high share of non-traded components. Trade prices have fallen considerably, not least due to the large decline in oil prices. According to the CPB, energy prices were down 51% in the fourth quarter. Consequently a smaller real drop is to be expected when deflating the value of trade flows with trade prices. The CPB figures quoted above are based on world trade price developments. A modelling exercise by the French Centre d’Études Prospectives et d’Informations Internationales (Bénassy-Quéré et al. 2009) illustrated these differences very clearly. Under two scenarios with the same world GDP growth, trade declined by 9% when deflated by the GDP deflator and only by 1.7% when using constant trade prices. Thus, a large part of the story hinges on global price developments. Nominal EU-27 exports grew 3% in 2008, while in real terms they fell 1% due to the oil-price hike and subsequent general weakness. Interestingly, this comes from falling real intra-EU exports (-2.3%), while exports to non-EU nations still grew 3.6% in real terms in 2008. In the US, nominal exports grew by as much as 12% in 2008, but only about half as much (6.4%) in real terms.
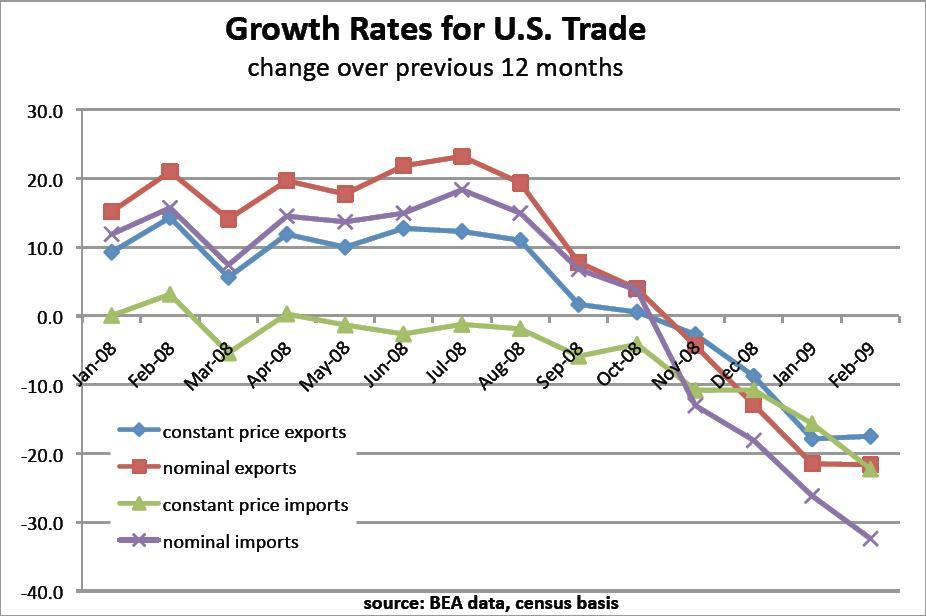
What is striking is the rapid drop in trade in the second half of 2008,shown in the figure below. Through August 2008, US exports were still 20% above corresponding August 2007 levels in nominal terms. However, the trade tides turned quickly, and by January 2009 exports at current prices were 21% below January 2008 levels, a change very much noted by the general public. Similar trends can be seen in European data. But even in real terms, the drop was huge. Real year-on-year growth rates in US trade exceeded 10% up until August 2008, followed by a stagnation of real exports and real declines beginning in November that amounted to as much as 20% in February 2009.
Figure 1. Growth rates for US trade, January 2008 – February 2009
Is the problem trade in particular?
The trade data are certainly disturbing. The fact that GDP contractions have been relatively minor compared to trade (5 or 6% in some countries in the last quarter of 2008, but nowhere near 20% as witnessed in early 2009 for trade) is the reason alarm bells have roused trade policy makers. Before we roll out the trade policy guns, however, we need to identify the underlying forces at work. If we break down recent trends in US trade, and control for the broad mix of price and sector changes driving the overall result, the trade changes look relatively consistent with the general pattern of this recession. The problem is not trade finance, but rather finance, full stop. This recession has been characterised by a massive collapse of credit mechanisms that has hit the capital goods and vehicle sectors particularly hard. It turns out that motor vehicles are also the driver of much of the recent trend in OECD trade data. We focus here on the US, but a similar story can be told with German data as well.
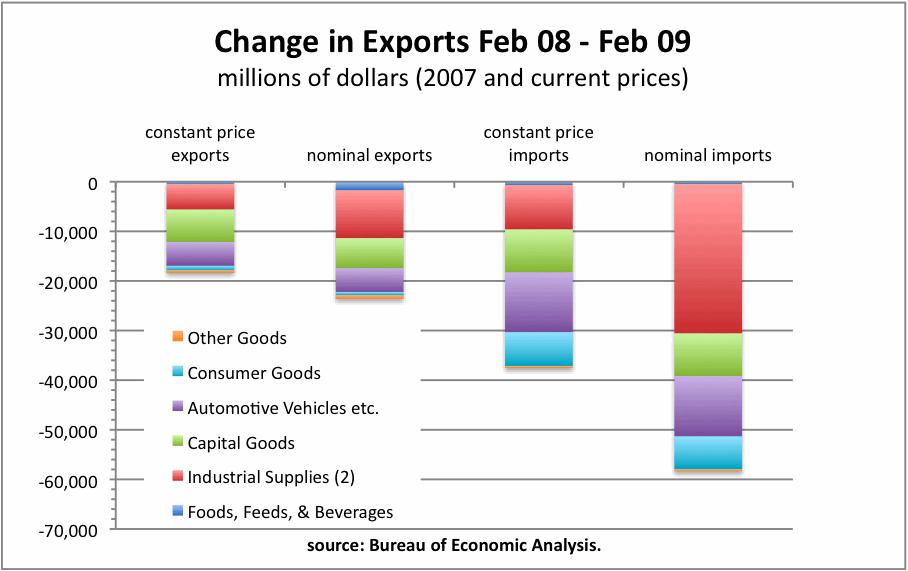
The figure below presents a breakdown in the change in US trade flows for the 12 months ending February 2009. We present both nominal and real flows. For real changes, we use BEA price deflators for traded goods by broad Census categories, as reported by the BEA. We have used these to express all real flows in 2007 dollars.
Figure 2. Change in US exports, February 2008 – February 2009
From the figure above, it is clear that roughly half of the drop in nominal imports over the 12 months ending in February 2009 was due to a drop in raw materials like oil (“industrial supplies” in the figure). However, much of this was due to the collapse in commodity prices. Once we control for this, 56% of the real drop in exports is in motor vehicles and capital goods. Raw materials represent another 24% of the drop. Motor vehicles and capital goods represent 62% of the real drop in exports. The drop in motor vehicle trade actually lags the corresponding drop in US production. According to the BEA, domestic production of cars was down 60% from February 2008 to February 2009. Over the same period, real exports fell “only” 45%, which is slightly better than the 47% drop from January 2008 to January 2009.
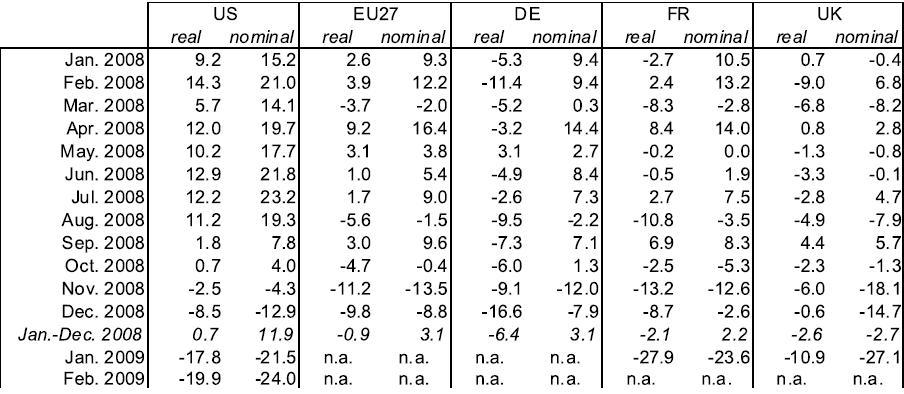
The table below presents the trade situation for a broader set of countries. For some countries the volume declines were magnified by price changes, for other countries real changes were dampened by prices changes.
Table 1. Year-on-year growth rates of monthly exports, January 2008 – February 2009
Source: Eurostat COMEXT, and BEA
We have clearly been witnessing a dramatic drop in world trade. For policy purposes, though, an important question is whether the decline is out of line with the global shock to GDP and the underlying credit crisis. At the moment, trade seems to be a victim, but one reflecting non-trade weaknesses in credit and demand. The countries with the greatest trade shocks are also more exposed to sectors hit hard by the recession. They are also victims, so far, of the general pattern of recession rather than of systemic protection. This does not mean we should let down our guard against protection. Rather, while maintaining a rearguard action against protectionism, the cure for the symptoms lies in curing the underlying illness – recession linked to a deep credit crisis.
References
Bénassy-Quéré, A., Y. Decreux , L. Fontagné, D. Khoudour-Castéras (2009), “Explaining the steep drop in international trade with mirage”, presentation at the informal workshop on ‘The Impact of the Economic Crisis on Trade’, April 9 2009, hosted by the OECD, Paris.
Bureau of Economic Analysis, US trade data downloaded on 20 April 2009
CPB Netherlands Bureau for Economic Policy Analysis (2009), “CPB Memo: World Trade Monitor”, downloaded on 21 April 2009
Eurostat, Common External Trade Database, downloaded on 20 April 2009


