The economic analysis of the budget of the EU has historically attracted significant attention, with a renewed interest emerging in the wake of the late 2000s Crisis and in view of the recent adoption of the Multiannual Financial Framework (MFF) 2014-20 (European Commission 1977, Freyer and Sacerdote 2013, Escolano et al. 2015). In a recent paper, I provide new evidence on the magnitude and main drivers of cross-border flows operated through the EU budget (D'Apice 2015). Within this context, a new measure of cross-border flows for the EU as a whole is proposed along with more common country-by-country measurements. I make use of a rich dataset on EU budgetary execution, allowing the role played by different funds to be disentangled. The period of time considered (2007-13) further allows the smoothing out of annual fluctuations and covers in full the previous MFF.
How is the EU budget financed?
The budget of the EU is financed mostly by national contributions based on GNI and a statistical VAT base. As a result of a system based on flat rates applied to harmonised bases, most (though not all) member states contribute a sum roughly equivalent to 0.9% of national income to the EU budget. Other revenues (custom duties and EU fines) account for 0.1-0.2% of EU GDP, so that the total revenue hovers around 1% of the EU GDP and fully matches expenditure. Despite several attempts by the European Commission to avoid ad hoc interventions, several exceptions and reductions have been introduced over time to an otherwise fairly simple system.1 Due to these corrections, countries such as the UK, the Netherlands, Sweden, Germany, and Austria reduce their combined GNI and VAT contributions by up to one third. National contributions hence vary between 0.6% and 0.9% of national income.
The expenditure side
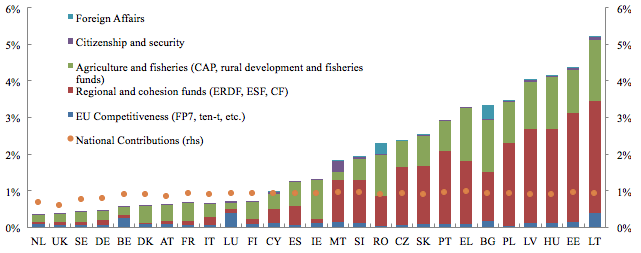
Unlike the revenue side, expenditure is quite heterogeneous across countries and ranges from 0.3% of GDP to 5% of GDP (Figure 1). Overall, it is strongly progressive, thereby fully offsetting the slight regressivity of the revenue side. Within the EU budget, the main channels of redistribution are the so-called Cohesion Policy funds,2 which account for only one third of the EU budget. This reflects the objectives of the policy, in turn enshrined in the EU Treaties (art. 174 to 178), which is to foster economic convergence and reduce disparities within Europe through the provision of public goods such as infrastructures, R&D, skills and human capital formation, etc. The role played by the rest of the EU budget in terms of redistribution is, on the other hand, negligible.3 It largely compensates for national contributions into the community budget (only partially for net contributors).
Figure 1. EU budget execution 2007-2013, yearly average expenditure, by main policy area and country, expressed as a share of gross national income
Source: European Commission
Calculating net balances
A straightforward way to calculate the net budgetary position of each member state is to deduct national contributions paid from EU outlays received. Although grossly misinterpreted as a proxy of 'net benefits',4 it is on the basis of this indicator that some member states have considered their contribution to the EU budget to be unduly large and have been successful in negotiating corrections. To calculate cross-border flows, we use two very simple and yet complementary measures. The first provides net national contributions to the EU budget as a share of each country's GNI.5 The second calculates the total amount of resources that flow from net payers to net receivers for the EU as a whole, as a share of the EU's GDP. Together they provide an overview of the cross-border flows operated through the EU budget at both the National and EU level. The results are then assessed vis a vis other benchmarks.
Net operating balances from a member state perspective
Net operating balances are of large macroeconomic significance for some member states, largely due to the concentration of Cohesion Policy spending in catching-up regions so to support convergence. Overall, average annual net payments from the EU budget were above 2% of GDP for eight member states. As shown in Figure 2, there is a strong correlation between GDP per capita and net outlays. Yet, the correlation is non-linear and largely breaks down for countries that are net contributors. As seen in the previous sections, the revenue system is broadly neutral (with rebates slightly tilting it towards regressive), whereas Cohesion Policy works strongly on the opposite direction on the expenditure side. The final result is that net flows are quite progressive for catching-up countries but broadly inelastic to income per capita among net payers.
Figure 2. Net contributions to the EU budget and GNI per capita by member State, 2007-2013 average
Source: European Commission
Net operating balances from an EU perspective
Despite some countries receiving sizeable transfers, the figures in the previous section are country-specific and do not provide a measure of the overall amount of cross-border flows operated through the EU budget. To do so, a broader measure of cross border flows for the EU as a whole is proposed. This indicator can be calculated by dividing the total amount of net inflows paid by net contributors (or net outflows received by net beneficiaries) by the GDP of the EU. Between 2007 and 2013, on average, the net contributors paid into the EU budget some €80 billion per year in gross terms. However, each year they received back around €52 billion.6
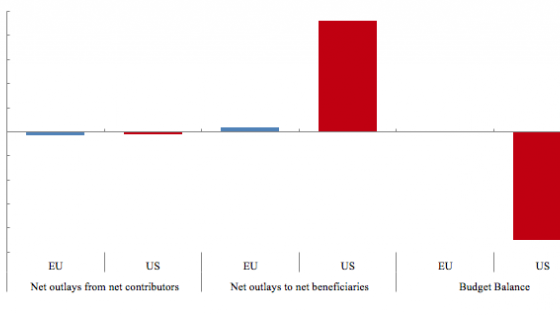
Nearly €30 billion are therefore transferred from net creditors to net beneficiaries within the EU. If we divide this amount by the GNI of the EU, we obtain a more indicative measure of the overall magnitude. As shown in Figure 3, this cross-border transfer is approximately equivalent to 0.25% of the GNI of the EU. In other words, for each euro paid by an average net contributor, approximately 75 cents are returned and 25 cents 'crosses a border'.
Figure 3. Cross-border flows operated through the EU budget (2007-2013 averages)
Source: European Commission
To provide a simple benchmark, cross-border flows within the EU can be compared to extra-EU cross-border flows. The latter can be approximated by official development assistance. Net transfers between the EU and the rest of the world (mostly foreign aid) amount, as an aggregate, to 0.5% of the EU GDP.7 Although the latter falls well behind the target agreed with the United Nations of 0.7% of GDP (the so-called ‘UN millennium development target’), the fact remains that transfers for official development assistance (at both national and community level) are twice as large as transfers within the EU. The degree of so-called ‘solidarity’ embedded in the EU budget is, in some sense, lower than the one towards the rest of the world; which is arguably already low.
Cross-border flows: What do they look like in the US?
While it may be more informative than foreign aid, comparisons between the EU and the US must be made with caution.8 First, unlike the EU, the US is a fully fledged fiscal and political union. Taxes collected at the federal level have ranged between 14% and 20% of GDP for the last 50 years, with an average of 17%. Of the federal revenue collected in 2012, for instance, the main sources of revenue were income and payroll taxes, which together account for 95% of total federal receipts. The EU, by contrast, collects roughly 1% of GDP and not directly via taxation but through transfers from member states. Second, the federal government in the US is responsible for more than half of total public expenditure and covers areas such as social security, education, and defence, while the EU spends less than 2% of total public expenditure and mostly in the form of sectorial policies (‘Economic Affairs’ in the COFOG classification).
While keeping these caveats in mind, the US example can provide an indication of the magnitude and drivers of cross-border flows involved in the intermediary and final stages of a federal union. In this respect, the US example remains a particularly useful benchmark because it represents a large continental area comparable to the EU for population, extension, economic development, and capital stock. Not least, it is relevant for the Eurozone member states, as the US states also share the currency.
Cross-border flows in the US during normal times
For the calculation of inter-states flows, we use data on federal tax collection and spending by state and category from the US Internal Revenue Service (taxes) and the US Census Bureau (spending), with deficit neutrality imposed in the long-term (pre-crisis) but allowing the short-term impact of federal borrowing on cross-border flows to be analysed during the crisis.9
On average, yearly cross-border flows within the US amounted to 1.5% of US GDP between 1980 and 2005, compared to 0.25% in the EU for 2007 to 2013. This is a substantial difference, but not astonishing, if one considers that the US budget is up to twenty times larger. For each euro paid by an average net contributor to the federal budget, about 90 cents return via the US budget (in normal times).10 At the margin, this is a lower redistributive power than the EU budget. Yet, because of the larger size (and scope) of the US federal budget, the overall redistribution is in fact six times larger.
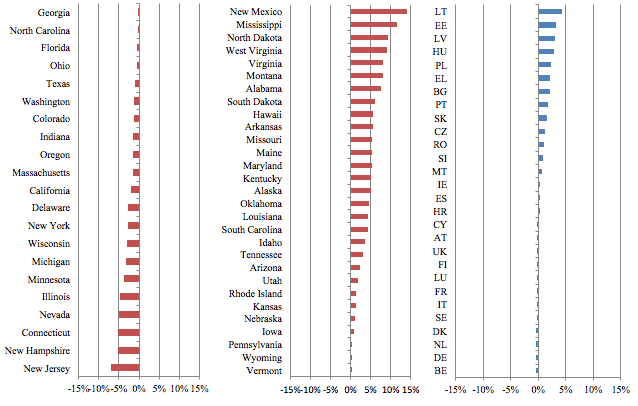
The impact of a broader budget on cross-border flows in the US is visible when looking at state-by-state data (Figure 4). Unlike the EU, where all net contributors broadly contribute a comparable amount as a share of their GDP (between 0.2% and 0.35% of GDP), US net contributions range from a few decimal points to 7% of GDP. As a share of their GDP, on average, net contributors paid 2.6% of GDP each year between 1980 and 2005 and at least eight US states contributed more than 3% of GDP in net terms.
Second, net transfers received by US states through the federal budget are significantly more heterogeneous than in the EU. They ranged from 0.2% of GDP in Wyoming to more than 10% of GDP in Mississippi and New Mexico. Within the US, at least 15 US states received more than 5% of GDP in yearly net transfers, on average, between 1980 and 2005. Within the EU, on the contrary, transfers range from 0.3% of GDP in Spain to about 4% of GDP in Lithuania.
Figure 4. Yearly net transfers to and from the US federal budget (1980-2005 average) and the EU budget (2007-2012 average), as a share of GDP of EU member states
Source: European Commission and Tax Foundation
Cross-border flows in the US in the wake of the Crisis
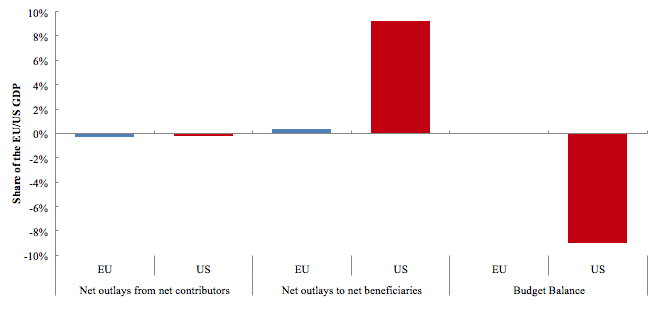
Unlike the EU budget, which must be balanced, the US federal government can borrow and did so heavily in the wake of the late 2000s Crisis. To analyse this period, deficit neutrality has not been imposed for 2009-2010 data (latest available), making it more relevant for assessing the impact of federal borrowing on states’ net balances (Figure 5). This explains both the large increase of net receivers and the difference between contributions and payments. Only three US states (Delaware, New Jersey, and Minnesota) were net contributors to the US federal budget during this period. The remaining 47 states all received more than they contributed to, in several cases significantly more than usual. Clearly, this extraordinary spending was not paid for by taxpayers in Delaware, New Jersey and Minnesota. In fact their net contributions to the US Budget amounted to 0.2% of the US GDP. On the contrary, it was largely paid for by the US federal budget deficit, which averaged around 9% of GDP in 2009-10. This is exceptional, and largely due to the impact of the Crisis. On the other hand, it also shows that a large part of the short-term stabilisation function within a large economy is played by the capacity for the federal budget to borrow from the market and not by an increase of regional transfers across states.
Figure 5. Average yearly cross-border flows operated through the EU and the US budget in 2009-2010
Source: European Commission, Internal Revenue Service (IRS) and Census Bureau
Conclusions
In short, our measurement of net operating balances and cross-border flows shows that:
- In line with the objective of Cohesion Policy to foster convergence, the EU budget redistributes amounts of resources that are significant for catching-up countries (up to 4% of GDP of the recipient country), but amount to a quarter of a point of the EU GDP for the community as a whole.
- Net contributions are progressive for the main beneficiaries but rather inelastic to differences in income per capita among net contributors. Since the main net beneficiaries of EU cohesion policy funds are not yet members of the euro area, cross-border flows approach zero if only the Eurozone is considered.
- To provide a first benchmark, we note that net transfers paid by the EU countries to the rest of the world in the form of 'official development assistance' amounts to 0.5% of the EU GDP. Although the latter amount is still arguably low, it is twice as high as the overall cross-border flows within the EU. One could thus argue that cross-border flows within the EU budget (or 'solidarity' as they are sometimes referred to) amount to half of those towards third countries (at both EU and national level).
- To provide a more relevant benchmark, net outlays received by net beneficiaries in the US are calculated using the same method, with results much larger in normal times (1.5% of US GDP versus 0.25% of EU GDP) due to the larger size of the federal budget, and incomparably larger in bad times (9% of US GDP versus 0.25% of EU GDP) due to federal borrowing.
- Equally important, these flows are not voted upon each year, but happen for the most part automatically and almost invisibly in light of the structure of the federal tax and spending system. They also partly stem from a direct fiscal relationship between the citizen – regardless of her residence – and the federal layer of government. Those are often overlooked points of departure from the EU framework, where revenues and expenditure are largely, and rather rigidly, defined on a country-by-country basis following periodical and rather intense inter-governmental negotiations.11
While keeping in mind the evident limitations and long-term perspective of these comparisons, the economics of our results is not new and the broad magnitude of our estimates is in line with more extensive analysis on the role of public finance in economic integration conducted four decades ago in view of the launch of the Economic and Monetary Union (e.g. European Commission 1977).12
Author’s note: The views in this column are exclusively those of the author and should not be attributed to the European Commission.
References
Escolano, Benedek, Jin, Grandados, Nozaki, Pereira, Rota Graziosi, Sinn, Torres (2015) "Distribution of fiscal responsibilities in federations”, in Designing a European fiscal union: Lessons from the experience of fiscal federations, C Cottarelli and M Guerguil (eds), Routlege.
European Commission (1977) Report of the independent expert group on the role of public finance in European integration, Volume I, Brussels, April 1977.
European Commission (2011) Financing the EU budget: Report on the operation of the own resources system, COM(2011) 510 final, Brussels, June 2011.
D'Apice, P (2015) “Cross-border flows operated through the EU Budget: An overview”, European Economy Discussion Papers, n.19, Directorate General for Economic and Financial Affairs, European Commission, Brussels.
Feyrer, J and B Sacerdote (2013) "How much would US style fiscal integration buffer European unemployment and income shocks? A comparative empirical analysis", American Economic Review, 103(3): 125-28.
Tax Foundation (2007) Federal Taxes Paid vs. Federal Spending Received by State: 1981-2005, Washington DC, October 2007.
Endnotes
[1] For a review of the history and functioning of the system of rebates see European Commission (2011).
[2] The main Cohesion Policy funds are the European Regional Development Fund (ERDF), the European Social Fund and the Cohesion Fund (CF).
[3] This is largely focused on the agricultural sector (about 40% of total). After 'EU Cohesion Policy' (35%, largely targeted to low-income regions), the third spending category is 'Competitiveness' (10%, largely targeted to R&D, lifelong learning, SMEs, and cross-border infrastructure). Foreign relations ('Global Europe') and administration account for nearly 6% each. Despite a cut of 4% in real terms, expenditure planned for the MFF 2014-20 is broadly in line with the previous MFF.
[4] From a communication perspective, net operating balances can be all too easily misinterpreted as 'return' from the EU budget. Although often used in the context of budgetary negotiations, this reading of 'net operating balances' is deeply misleading and suffers from four important shortcomings. First, it would imply that the EU budget was a zero sum game, where a participating country can only gain at the expenses of others. Second, and more fundamentally, identifying net operating balances as 'net impact' confuses inputs with outputs and fails to account for spillover effects and common gains. Net benefits go beyond net operating balances and include broader economic impacts in terms of trade opportunity, employment and productivity (both in terms of first and second round effects). Third, the data on net operating balances is simply cash and therefore bound to be only broadly indicative from an economic geography perspective (e.g. problems with mapping of real final beneficiaries, incidence of custom duties, etc.). For instance, EU funds may finance a project in one country, but the entity executing the project (and eventually receiving the EU resources) may be from a different country. Fourth, financial instruments, lending from the European Investment Bank and domestic investment leveraged through the EU budget are not taken into account. Although different from grants, they determine economic impacts that are not captured by net operating balances indicators.
[5] For reasons of consistency and transparency, net operating balances are calculated according to the Commission guidelines. Expenditure on administration and revenue from custom duties, hence, are not considered as national outlays or contributions. The financing of the rebates for the UK, Germany, Austria, Sweden, and the Netherlands are instead fully taken into account. For more information on the calculation of net operating balances, please visit the Commission website.
[6] Similarly, between 2007 and 2013, net beneficiaries have received some €55 billion from the EU budget while paying around €22 billion into it. National payments refer only to national contributions and therefore do not include custom duties and sugar levies (traditional 'own resources'). Expenditure does not include administration and spending directed towards non-EU countries. Both items represent between 10% and 15% of the total EU budget but cannot be assigned to a member State and therefore are not considered in these calculations. The same general caveats expressed for net operating balances (see footnotes 5 and 6), hence, apply here too.
[7] This is the sum of foreign aid granted at both the national and community level by EU member states.
[8] Due to the nature of the US social security system, which is federal, it is perfectly possible that payroll taxes are paid from one or several states throughout the career of an employee and the benefits paid out in yet another state. Similarly, a non-negligible part of federal expenditure is related to public procurement expenditure and salaries and wages which do not represent fiscal transfers. This is also why we prefer to use the expression 'cross-border flows'. Rather than actual fiscal transfers, our estimates would nonetheless provide an approximation of the cross-border cash flows operated automatically by the US federal budget, under the constraint of the data available and given the competences of the federal government.
[9] For the pre-crisis period we used a database building on those sources and having the advantage of imposing deficit neutrality on its estimates (Tax Foundation 2007). It provides, hence, an approximation of the amount of cross-border flows that may be considered 'physiological' in the US and takes full account of the cost of the federal deficits incurred to sustain them. For the post-crisis period, we instead constructed a similar database without imposing deficit neutrality to analyse the short-term impact of federal borrowing on cross-border flows.
[10] This indicative measure is obtained by dividing average cross-border flows in the US (1.5% of GDP) by average federal revenue (17% of GDP). Considering that federal revenue and expenditure fluctuates much more in the US, this measure is more volatile and sensitive to the base in the US than the EU (in the EU the maximum size of the budget is set in the MFF and revenue must match expenditure at all times). The impact of federal borrowing is not considered here (see footnote 10). This is limited in normal times, but becomes more significant in the wake of economic crisis.
[11] As a thought experiment, it would be interesting to reflect on whether flows of the magnitudes of those estimated for the US, a strong political union, would take place if an adoption procedure similar to the one in place for the EU budget was in place.
[12] Given its current redistributive power, a EU Budget of about 6% of the EU GDP would in theory allow for cross-border flows of a magnitude comparable to that in the US. This is obviously just a simple linear extrapolation, with no economic policy relevance, but it is interesting to note that a budget of about this size (and a considerably broader scope) was advocated for the earlier stages of economic and monetary union in the "Report of the study group on public finance in European integration" (European Commission, 1977), based on insights from the theory of fiscal federalism and a much more comprehensive empirical analysis of public finance in five federations (Germany, U.S.A., Canada, Australia, Switzerland) and three unitary states (France, U.K., Italy). In the context of the perspective launch of the Economic and Monetary Union, the report recommended a gradual yet sizeable increase of the scope and size of the budget over the medium term. In the short term, it should have rapidly increased from a size of 0.7% of EU GDP (at the time) to around 2%-2.5% of the EU GDP, largely to support structural, external and cyclical policies (including possibly an unemployment insurance fund). This should have served as a preparation for the actual launch of the EMU, which would require – according to the analysis of the authors - a size of 5%-7% of GDP (or 10% including defence) to be sustainable in the medium term and a size of 15%-25% in a fully federal stage possibly conceived in the very long term. This view was partly re-assessed by subsequent reports (e.g. European Commission, 1993) arguing that a small 'EMU budget' of about 2% of Community GDP would be sufficient to sustain EMU. Again, increases would have been mostly in structural, external and cyclical policies. While acknowledging that this finding was 'clearly contrary to much of the conventional economic wisdom, reflected in the MacDougall report as well as in the literature on economic and monetary union', there were three distinctive reasons underpinning it: (1) the principle of subsidiarity was applied more rigorously than in the past, (2) no explicit role was foreseen for the EU Budget in community-wide macroeconomic stabilisation, (3) the economic case for a permanent and substantial increase in interregional redistribution, as a direct consequence of EMU, was considered to be weak. A more recent criticism is that financial markets are much more developed now than in the past and would therefore allow for more contingent rather than permanent schemes. It remains still unclear, however, whether those flexible arrangements – while surely helpful - would fully substitute or just complement more traditional budgetary functions.


