Energy-efficiency standards for buildings and appliances and vehicles appear to be a central component of climate policy in the US. New energy-efficiency regulations account for 44% of projected greenhouse gas emissions reductions from California's Global Warming Solutions Act of 2006, 36% of projected reductions from Massachusetts's 2008 Act, and about a third of the policy proposals in President Obama's June 2013 climate speech at Georgetown University.1 But do energy-efficiency standards work?
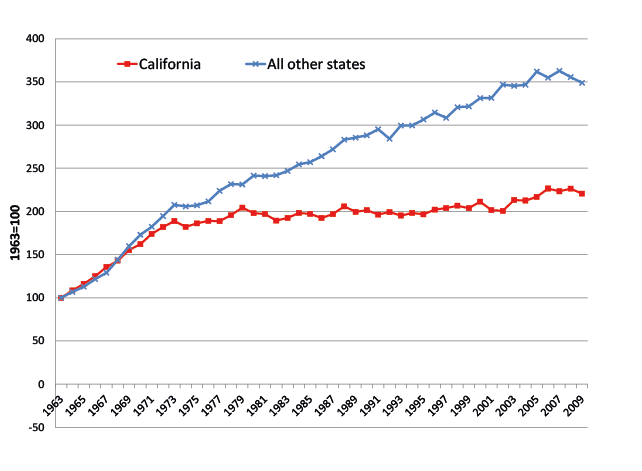
The highest profile piece of evidence supporting the efficacy of energy-efficiency regulations is Figure 1, which plots an index of residential electricity consumption per capita in California – the bottom line, flat since the 1970s – against that same index for the rest of the US (Rosenfeld and Poskanzer 2009). Many supporters of efficiency standards have cited the divergence in those two lines as evidence that California's first-in-the-nation building and appliance standards, enacted in the 1970s, have been effective. Those supporters include the World Bank, the US. Secretary of Energy, leading newspaper editorial pages, prominent environmental NGOs, and of course California's own regulators.2
Figure 1. Residential electricity per capita
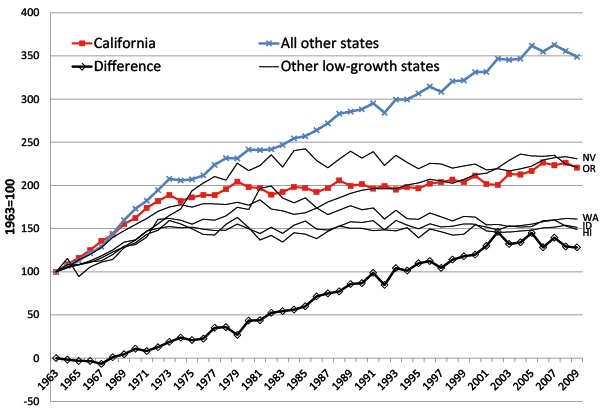
There are, however, reasons to be suspicious. The gap between California's and other states' electricity consumption, depicted as the bottom line in Figure 2, preceded California's regulations and has grown steadily. And the five other states with the slowest electricity growth, also depicted in Figure 2, are California's neighbours: Nevada, Oregon, Washington, Idaho, and Hawaii. Perhaps California's relative electricity savings are the result of long-run trends peculiar to the western US and unrelated to California's regulations.
In Levinson (2013) I describe how those long-run changes can explain 88% of the gap between California's and other states' residential electricity consumption per capita, and how therefore Figure 1 doesn't prove what its proponents claim.
Figure 2. Reasons to be suspicious
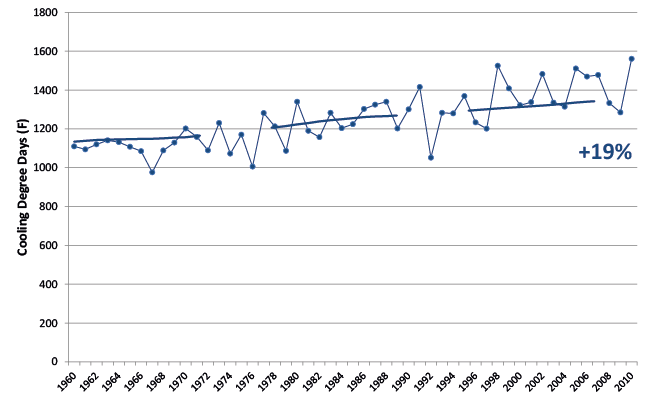
First, the population of the other 49 US states has gradually shifted to the south and west, where the climate is hotter and air conditioning more desirable, driving up electricity demand in those states. Figure 3 plots the population-weighted annual average cooling degree days in those other states over the past 50 years.3 It rose 19%, not because the climate changed but because the average non-Californian US citizen lived in a hotter place. This change by itself can explain 15% of the gap between California's and other states' residential electricity growth per capita.4 That's 15% for which California regulations cannot claim credit.
Figure 3. Population-weighted cooling degree days in other states
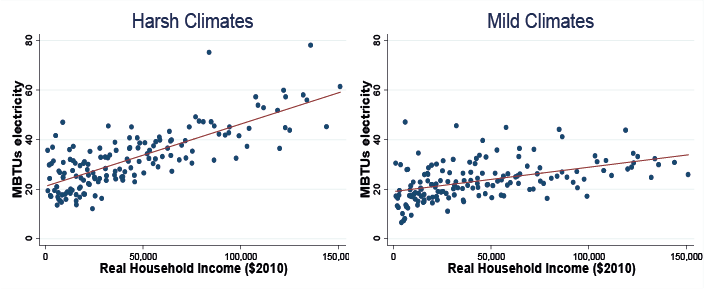
Second, incomes have grown throughout the US over the past 50 years. Where the climate is harsh, income growth leads to more electricity demand for space heating and cooling, as depicted on the left side of Figure 4. Where the climate is mild, income growth leads to less of an increase in electricity use, as on the right side of Figure 4 (and in California). As a consequence, nationwide income growth has led to less electricity growth in California's mild climate than in the rest of the country. This difference by itself can explain 20% of the gap between California's and other states' residential electricity growth per capita. That's 20% for which California's regulators also deserve no credit.
Figure 4. Residential electricity, household income, and climate
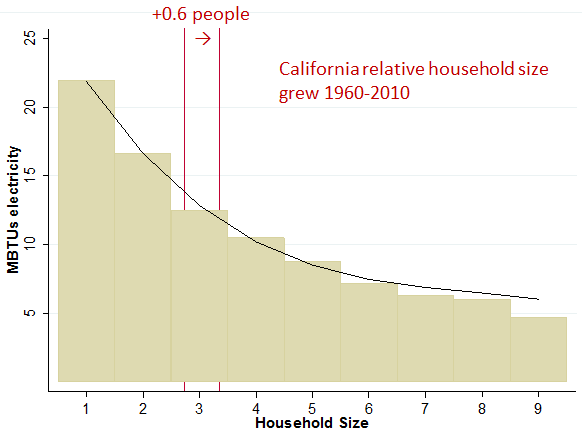
Third, there are economies of scale in residential energy consumption. Electricity use increases less than proportionately with household size, which means that electricity use per capita decreases with household size as depicted in Figure 5. While average household sizes have been shrinking throughout the US over the past 50 years, in California household sizes have remained nearly constant. California households effectively gained 0.6 members, on average, relative to other states. This change by itself can account for 40% of the gap between California's and other states' residential electricity consumption per capita.
Figure 5. Electricity per capita decreases with household size
Combining the effects of climate, income, and household size, accounting for interactions among them, and adding other differences between California and the rest of the US, Levinson (2013) explains 88% of the gap between California's and other state's per capita electricity consumption. Figure 1, cited widely as evidence for the efficacy of energy-efficiency standards, is thus mostly due to changes unrelated to those standards. The famous figure doesn't demonstrate what its proponents claim.
To be clear, just because Figure 1 fails to prove that California's efficiency standards worked doesn't mean the standards didn't. Other states and the US federal government followed California's early lead and enacted their own building and appliance standards, and so perhaps residential electricity growth nationwide – in California and other states – has been lower than it would have been without those laws. If so, that outcome cannot be seen by comparing California to other states because both lines in Figure 1 may be lower than they would have been without efficiency standards. The result in Levinson (2013) does not prove that energy-efficiency standards didn't work; it only shows that the famous Figure 1 is uninformative.
Efficiency standards appear to be at the center of US climate policy. We ought to have a better understanding of their effectiveness.
References
California Air Resources Board (CARB) (2008), "Climate Change Scoping Plan".
California Public Utilities Commission and California Energy Commission (2006), "Energy Efficiency: California's Highest-Priority Resource".
Charles, Dan (2009), "Energy Efficiency: Leaping the Efficiency Gap", Science 325(5942), 804-811.
Massachusetts Secretary of Energy and Environmental Affairs (2010), "Massachusetts Clean Energy and Climate Plan for 2020: A report to the Great and General Court pursuant to the Global Warming Solutions Act".
Rosenfeld, Arthur H and Deborah Poskanzer (2009), "A Graph Is Worth a Thousand Gigawatt-Hours: How California Came to Lead the United States in Energy Efficiency", Innovations, Fall, 57-79, .
Levinson, Arik (2013), "California Energy Efficiency: Lessons for the Rest of the World, or Not?", NBER Working Paper No. 19123.
World Bank (2010), World Development Report 2010, Washington, DC.
1 See California Air Resources Board (2008); Massachusetts Secretary of Energy and Environmental Affairs (2010), p. ES-6; www.whitehouse.gov/the-press-office/2013/06/25/remarks-president-climate....
2 World Bank (2010); Charles (2009); California Public Utilities Commission and California Energy Commission (2006).
3 Cooling degree days are the number of degrees that a day's average temperature is above 65°F.
4 California is large and has had its own share of internal population shifts. Since 1960 California’s population has migrated to less temperate regions, with a bit more electricity use per capita. If electricity consumption per capita in each California county is held constant at its 2010 level, the increasing share of the population in more energy-intensive counties would add 4 percent to the state’s overall per capita electricity consumption from 1960 to 2010.
