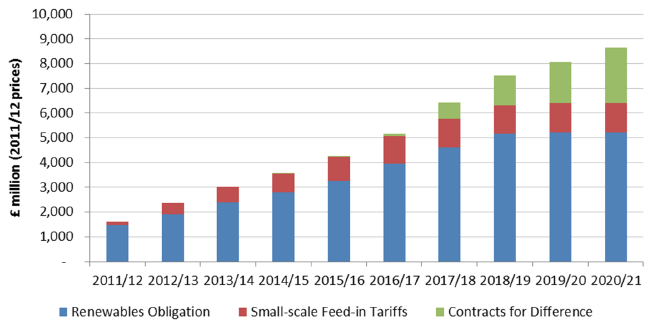
The cost of supporting renewables is rising rapidly in the UK, as Figure 1 shows.1 Each form of support payment is a contract, typically lasting 15 years. So past commitments will continue to be honoured, and consumers of electricity pay for them as a supplement to their bills.
The Energy Act 20132 aimed to cap the levy support payments at £7.5 billion in 2020, but that levy cap will most likely be breached. The 2017 cost of the levy in current prices is 2p/kWh, or £68 each year for the average household, with demand of 3,300 kWh. It is 11% of the average bill, considerably less than the 15% subsidy provided by charging only 5% VAT, rather than the standard 20% rate.
Total renewables supported (which excludes hydro) generated 73 TWh in 2017 (Department for Business, Energy & Industrial Strategy 2018), so the subsidy is £96/MWh, compared to (and on top of) the average wholesale price of £46.40/MWh.3
Figure 1 Levy control framework and projections
Source: Helm (2017).
Note: Multiply by 1.1 to give the costs in 2017 prices. Electricity consumption 2017: 310TWh (Department for Business, Energy & Industrial Strategy 2018, Table 5.4).
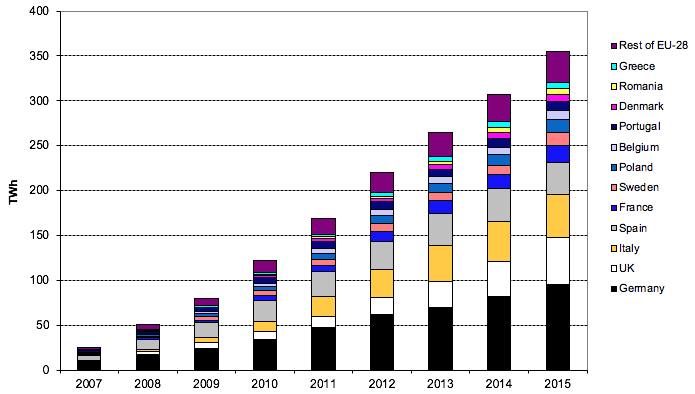
The UK started slowly in meeting its obligations under the EU Renewables Directive (2009/28/EC), which mandates agreed shares of total energy (not just electricity) from renewable sources by 2020, but has recently accelerated. Figure 2 shows the cumulative increment in renewables electricity generation (RES-E) in EU member states from 2005. Between 2005-2017 the UK added 67.7TWh of supported renewable generation, representing 22% of 2017 total consumption. Other countries, notably Denmark, Portugal and Germany, added even more as a share, although Figure 2 shows that the UK was the second largest absolute contributor.
Figure 2 Cumulative additions to the share of renewable electricity, 2005-15
Source: Eurostat.
Eye-watering levels of support
As a result, support has reached eye-watering levels in countries like Germany, where the four transmission system operators (the high-tension grid companies) paid €26.3 billion (£23.2 billion) in 2017 to renewable electricity generators for 218TWh. This is a support of €116/MWh (£103/MWh), slightly above the UK rate. It is also 3.6 times as much renewable energy as the UK, although Germany has only 26% more people.4
The support costs in both countries are just the explicit support costs for electricity and exclude renewable heat and renewable transport fuel subsidies. In 2017, 14.8%, or nearly £90 of the £601/year cost of the cheapest type of English bill, represented “environmental and social obligation costs”, according to Ofgen5 – though that also includes energy efficiency measures and fuel poverty support.
The case for supporting renewables
These figures, however, need to be put in context. First, most countries underpay the costs of climate damage caused by electricity generation, so part of the renewable subsidy can be considered a payment for the CO2 avoided by displacing fossil fuels. Britain is ahead of most other countries in levying an additional Carbon Price Support (CPS, effectively a carbon tax) of £18/tonne of CO2 on fuels used to generate electricity. Added to EU emissions prices, this brings the CO2 price up to £32/tonne, which adds about 1.4p/kWh to the cost of generating electricity from a gas-fired plant, and twice that for coal. The CPS accounts for £32 of the average electricity bill.6 Other EU countries use just the EU emissions price, which in July 2018 was only half the British level. If the true cost of climate damage were higher than £32/tonne CO2, then Britain would be undercharging for its electricity use, and some additional payment to renewables would be justified.
The German electricity sector emitted 350 million tonnes of CO2 in 2017 (Matthes 2017) at an average intensity of 0.98 t CO2/MWh of fossil generation. If one considers the UK figure of £32/tonne, a plausible estimate for the cost of CO2 damage, the 218 TWh of German renewables might have displaced 214 mt CO2, worth an additional £18/tonne or £3.85 billion (€4.35 billion). This is 17% of the reported grid payments to support renewables, still far short of the total renewable subsidy.
Renewable subsidies are mainly justified by their learning spillovers
The EU’s climate change mitigation strategy has three pillars, only one of which – the Emissions Trading System – involves pricing carbon. Even then, the price is inadequate. The other two are the Renewables Directive (2009/28/EC) to support immature renewables, and the Strategic Energy Technology Plan(EC 2017) to stimulate R&D for clean technologies.
Most renewable technologies are not yet competitive on cost with mature carbon-intensive technologies, but by stimulating their production and deployment, future costs will be lower thanks to learning-by-doing and, if they become competitive in future, the whole world will then find zero-carbon options better than fossil options. This will encourage carbon reductions at global, not just European, scale. Figure 3 shows Swanson’s Law7 – that doubling the cumulative production of solar PV modules reduces their unit cost by 20%. The relationship has held for more than 40 years and shows no signs of changing.
Figure 3 Cost reductions for a doubling of solar PV module shipments (double log scales)
Producers of renewables like solar PV sell in intensely competitive markets and are not rewarded for the future cost reductions their actions cause, but in recent research (Newbery 2018) I estimate the spillover benefits to the rest of the world of the support offered to date, reproduced in Table 1.8 To the end of 2015, the installed capacity of solar PV had generated some $100-170 billion in the present discounted value of future cost reductions, and by 2018 solar PV was competitive without subsidy in many sunny countries like Chile. Together the top six countries contributed 80% of this investment in future cost reduction benefits, so the EU Renewables Directive can be justified by the global benefits it helped stimulate. Mission Innovation is a recent attempt to broaden this collective support more widely. Under it, 22 countries and the EU intend "to double their public clean energy R&D investment over five years”.9
Table 1 Spillover contributions by country (total $ million per year)
Source: Newbery (2018). Data source for capacities: Wikipedia, Growth of Voltaics.
Similar, if less dramatic, learning spillovers can be measured for wind (7-12% per annum). The halving of the cost of supporting off-shore wind in the recent UK auctions is a dramatic example of the benefits of assuring a future market on which to develop production capabilities and the supply chain (KPMG 2017).
Conclusion
Supporting renewables may be expensive, but the alternative of a future energy system lacking the benefits of low-cost zero-carbon technologies is even more costly. The policy goal is to devise ways of collectively financing such support (and supporting R&D) so that the individual costs are smaller than the individual benefits of avoided climate damage for each country. This would make more countries willing participants in projects such as Mission Innovation.
References
Department for Business, Energy & Industrial Strategy (2018), Digest of UK Energy Statistics.
European Commission (2009), Directive on the promotion of the use of energy from renewable sources, 2009/28/EC
European Commission (2017), The Strategic Energy (SET) Plan.
Helm, D (2017), Cost of Energy Review: Report, Department for Business, Energy & Industrial Strategy.
KPMG (2017), Results that will blow you away: CfD allocation round two.
Matthes, F C (2017), "Decarbonising Germany’s Power Sector", IFRI note.
Newbery, D (2018), "Evaluating the case for supporting renewable electricity", Energy Policy 120: 684–696.
Endnotes
[1] Renewables Obligation is the payment to renewable electricity generators who receive payments in addition to the wholesale market price, Feed-in-tariffs are payments to smaller producers (mostly for household solar PV panels) while Contracts-for-difference payments are the replacement of the Renewables Obligation introduced in the Energy Act 2013.
[2] HMSO 2013.c.32.
[3] https://www.ice.org.uk/knowledge-and-resources/briefing-sheet/the-changing-price-of-wholesale-uk-electricity.
[4] Andreas Mihm in the Frankfurter Allgemeine Zeitung, cited here. Earlier costs are available here.
[5] https://www.ofgem.gov.uk/data-portal/breakdown-electricity-bill for August 2017.
[6] Average carbon intensity of electricity in 2017 is 0.31 kg CO2/kWh, average consumption 3,300 kWh.
[7] The straight green line predicts that modules decrease in price by 20% for every doubling of cumulative shipped modules. The other line (with squares) shows world-wide module shipments vs. average module price. Data can be updated from http://www.itrpv.net/Reports/Downloads/.
[8] Newbery (2018) derives formula for the global spill-over (i.e. unremunerated external) benefits of installing 1 kW peak solar PV each year, while the data source gives installations by country and year. There is considerable uncertainty about the parameters, hence the range of plausible values.
[9] See http://mission-innovation.net/.


