The rapid spread of COVID-19 has left countries hit by the pandemic with very little choice but to shut down their economies. The almost uniform effort to ‘flatten the curve’ and preserve hospital viability has been to impose lockdowns and strict forms of social distancing: ‘stay home’ is the motto that governments – from Wuhan to Milan, from Madrid to New York – have promoted to break the chain of contagion. In many countries, campaigns to convince citizens to comply with social distancing have been put in place and popular actors, religious leaders, even football players have been mobilised to spread the message and raise awareness throughout the population. The goal is to persuade people to internalise the externality they would impose on the community by not reducing their mobility. Indeed, given the limited capacity of the state to enforce lockdowns on a large scale, persuasion seems crucial to achieving social distancing and reaping its potentially vast benefits in terms of lives saved (Greenstone and Nigam 2020, Stock 2020).
A role for civic capital?
Is there a role for civic culture in the spread of pandemics? The internalisation of the externality created by personal mobility is likely to depend on citizens’ capacity to contribute to the ‘public good’. Indeed, contagion avoidance is a public good: any individual behaviour that limits contagion contributes to slowing the spread of the virus, thus lowering the probability of infection for all members of the community – a positive externality. Communities with higher levels of civic capital tend to be better at acting collectively and providing public goods (e.g. Putnam 1993, Herrmann et al. 2008). The more civic capital, the greater the adherence to social distancing, the slower the spread of the epidemic. If civic capital is strong enough, it can induce social distancing at a very early stage of the epidemic, even in the absence of government interventions and persuasion campaigns.
To shed light on the role of civic capital in promoting social distancing, we examine the evolution of individual mobility across Italian provinces over the past two months. We focus on Italy, a country that has been hit hard by the pandemic and is characterised by large and well-documented differences in civic capital across provinces (e.g. Putnam 1993, Guiso et al. 2004). Data on individual mobility are based on phone location tracking that records the number of movements an individual makes during the day from home (identified as the place where an individual regularly spends the night) to work or to other places such as shops, bars, restaurants, gyms, etc. and vice versa, with each trip from one place to another counting as one movement. So an individual not leaving her home during the day would count as zero movement, while another going from home to the grocery store and back would count as two movements.
We use daily data on the number of movements per capita in each Italian province between 1 February and 26 March 2020.1 We combine this information with three proxies of civic capital commonly used in the literature: the number of blood donations (per 10,000 people), a survey-based measure of trust in others, and a measure of newspaper readership.2 Since each of these variables captures different facets of pro-social attitudes, we use the first principal component of the three as a summary index of civic capital.3
Crucially, we look at the relationship between civic capital and the evolution of mobility before and after two critical dates. The first is 21 February, when the first COVID-19 hotspot was identified near the town of Codogno and a ‘red zone’ was established to restrict mobility into and from the area. This episode attracted extensive media coverage and made Italians aware of the immediate threat of a COVID pandemic in the country. The second is 9 March, when the national lockdown decided by the Italian government came into effect. Looking at how mobility evolved between 21 February and 9 March allows us to test whether individuals in areas with higher civic capital were more likely to internalise the social cost of their mobility and voluntarily engage in social distancing even before government intervention. (Results from after 9 March could reflect citizens’ voluntary response and their higher tendency to abide by the new rules.)
Key results
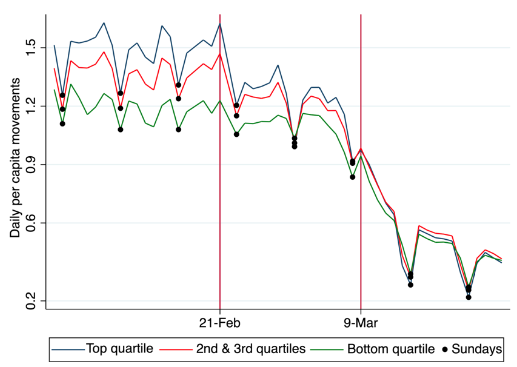
Figure 1 summarises our main results. The top panel shows the evolution of daily per-capita movements in provinces with civic capital in the top quartile (blue), between the second and the third quartile (red), and the bottom quartile (green), respectively. The black dots represent Sundays, when work-related movements drop. The graph depicts three periods:
1) before the first COVID-19 hotspot was identified,
2) after the hotspot was identified but before the lockdown was implemented, and
3) after the start of the lockdown.
In the weeks prior to the outbreak, provinces with high civic capital displayed greater mobility than provinces in the middle and especially at the bottom of the civic capital distribution. Over this period, the daily pattern of mobility is very regular from one week to the next. After the first hotspot was identified and public awareness of the outbreak rose, mobility started to drop in all provinces. Strikingly, it declined much faster in high civic capital provinces than in others, narrowing the gap observed in the pre-virus period. This pattern is consistent with the idea that, as soon as the threat of the virus became real, communities with high civic capital started to self-restrain and to internalize the risk of propagating the infection through social contacts.
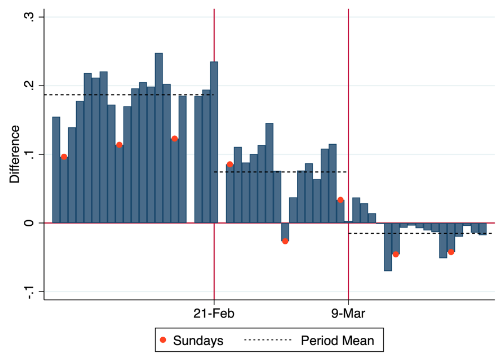
Indeed, as shown in the bottom panel of Figure 1, while in the pre-pandemic period the gap between provinces in the top quartile of the civic capital distribution and the others equalled 0.18 movements per day (about 13% of the national average in that period), in the second period it was only 0.076 (about 6% of the national average). Once the lockdown was in place, mobility fell rapidly and dramatically in all provinces, but more in high civic capital provinces, so much so that the gap with the other provinces closed completely. On Sundays, when there were no work-related displacements, citizens in high civic capital communities moved less than people in low civic capital provinces, suggesting that they were more willing to sacrifice leisure-related mobility to break the chain of contagion, and that the pattern observed in the data is not due to differential work activity.
Figure 1 Daily movements during the spread of the virus and civic capital
a) Evolution of mobility by quartile of civic capital
b) Difference in mobility between provinces in the top 25% of the civic capital distribution and others
The evidence discussed thus far is based on raw data: merely dividing provinces by different levels of civic capital. In Figure 2, we show the effect of high civic capital on mobility over the three periods after controlling for:
1) average differences across provinces (province fixed effects);
2) daily changes in overall mobility (day fixed effects);
3) the total number of cases recorded in the province until that day; and
4) differences in the evolution of mobility related to variation across provinces in a set of geographical characteristics (area, altitude, proximity to the coast, population density), socioeconomic characteristics (level of urbanisation, education, number of firms per capita), and three measures of vulnerability to the infection (share of male population, presence of an airport, number of ICU beds in the region).
Controlling for differential trends in mobility related to socioeconomic characteristics is particularly important because these tend to be correlated with civic capital. Controlling for the number of cases and for the (time-variant) effect of ICU beds rules out the possibility that the faster drop in mobility in high civic capital provinces is induced by fear of contagion or concern with the (in)ability of the local health system to cope with the infection.
The pattern depicted in Figure 2 is consistent with that in Figure 1. Prior to the beginning of the outbreak, there is no significant difference in mobility between high civic capital provinces and the others, once other factors are controlled for. However, the effect of high civic capital on mobility becomes visibly negative as soon as the first hotspot is identified, and even more so after the national lockdown is implemented. Importantly, results are similar when restricting the sample to only Northern provinces or Southern provinces respectively – indicating that the results are not merely driven by a North-South divide – and when excluding provinces in Lombardy, by far the hardest-hit region.
Figure 2 Mobility and civic capital (above-below the top 75th percentile)
Average weekly differences, after controlling for province daily effects and interactions effects
Final thoughts
The evidence presented above suggests that differences in civic culture can significantly impact the effectiveness of social distancing policies aimed at containing the propagation of the virus. Communities with high civic capital adopt social distancing even before they are required to do so, which contributes to early containment of the virus. They are also more responsive to explicit stay-home policies promoted by the government, which allows for more efficient management of the externalities associated with the spread of the virus. Early, spontaneous social distancing can be extremely valuable if, as seems to be the case, democratic governments hesitate to impose early-stage strict lockdowns, which, while effective in fighting the virus, are economically and politically costly.
References
Greenstone, M and V Nigam (2020), “Does social distancing matter?”, University of Chicago, Becker-Friedman Institute Working Paper, March.
Guiso, L, P Sapienza and L Zingales (2004), “The Role of Social Capital on Financial Development", American Economic Review 94(3): 526-556.
Herrmann, B, C Thöni and S Gächter (2008), “Antisocial punishment across societies”, Science 319: 1362–1367.
Putnam, R (1993), Making democracy work, Princeton University Press: Princeton, NJ.
Stock, J H (2020), “Data gaps and the policy response to the novel coronavirus”, COVID Economics Issue 3, London: CEPR Press.
Baldwin, R and B Werder di Mauro (2020), “Economics in the Time of COVID-19”, London: CEPR Press.
Endnotes
1 The data were collected by Teralytics for the Italian newspaper La Repubblica and made available on the newspaper’s website here. They cover all current Italian provinces and metropolitan areas as well as the Friuli-Venezia-Giulia and the Aosta regions.
2 Data on the number of blood donations per province come from the Italian Association of Blood Donors (AVIS) and are only available for 1995, for 92 of 95 Italian provinces. The measure of trust is based on data from the ISTAT survey on the use of time conducted between 2010 and 2015, and represents the share of respondents in a province who report trusting people when asked the question: “Generally speaking would you say most people can be trusted or you can’t be too careful”. Finally, data on newspaper readership are from ADS and refer to the period 2005-2010. Our sample does not include the provinces of Belluno and Isernia and the Aosta region for lack of data on blood donation, and the new province of South Sardinia for the impossibility to impute historical data to the new jurisdiction.
3 We obtain similar results using each of the three variables separately.


