Earlier this month, the Trump administration repealed the Clean Water Rule, which is also known as Waters of the US Rule. This rule sought to ensure that federal water quality regulation protected most US rivers and streams. The rule was originally created under the Obama administration and its repeal has been controversial.
Until the 2000s, courts and the Environmental Protection Agency typically assumed that the 1972 Clean Water Act, one of the most iconic environmental laws in US history, protected most US surface waters. The Clean Water Rule responded to two Supreme Court cases from the 2000s which had created uncertainty over whether the Clean Water Act protected certain waters, including wetlands, intermittent, and ephemeral streams.1
Some industry groups and farmers have celebrated the Trump administration’s repeal. These groups argue that the Clean Water Act was not intended to protect smaller intermittent streams and that protecting those waters would constrain their businesses. Environmental groups, however, have decried the Trump administration’s repeal of the Clean Water Rule as likely to worsen public health and increase water pollution.
A serious controversy surrounding the Clean Water Rule involves its associated benefits and costs. Under the Obama administration, the Environmental Protection Agency estimated that the Clean Water Rule passed a cost-benefit test. A revision of this analysis performed during the Trump administration reversed this finding and estimated that this Rule created larger costs than benefits.
This reversal was due to the Trump administration assuming away a large share of benefits attributed to wetlands. Administration officials defended this action, arguing that these benefit estimates were estimated over 20 years ago. Boyle et al. (2017) argue that the administration’s assumption is troublesome.
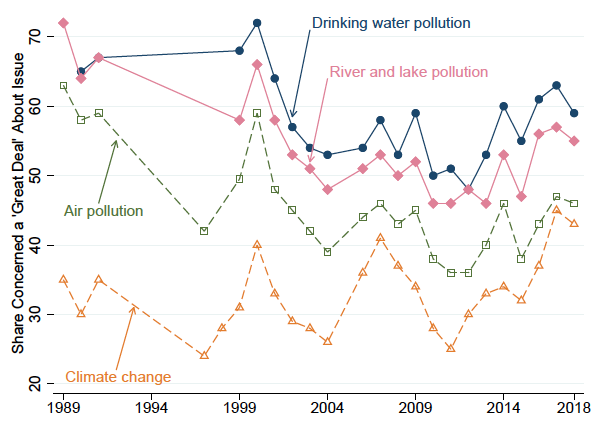
The controversy highlights a deeper issue involving US water quality policy. For the last several decades, Americans have consistently reported surface water and drinking water pollution as being among their top environmental concerns (Figure 1). Yet, many regulations governing surface water quality fail to pass a cost-benefit test.
Figure 1 Share of population concerned a “great deal” about various environmental issues
Source: Keiser and Shapiro (2019a)
Drinking water regulations fare better, as do regulations that govern other pollutants such as air pollution and greenhouse gases. As the 50th anniversary of the US Environmental Protection Agency approaches, we seek to better understand the effectiveness of the key laws that govern US surface and drinking water quality, the efficiency of these laws, and the state of economic research on water quality and other media (Keiser and Shapiro 2019a).
How have the Clean Water Act and Safe Drinking Water Act affected water quality?
The Clean Water Act relies heavily on two main components. The first is federal funding to help local communities build and upgrade wastewater treatment plants. A wastewater treatment plant is an industrial site that receives sewage and some industrial wastes from underground pipes and then treats them to remove pollution before discharging the cleaned water to a river, lake, or ocean. The second component is the National Pollutant Discharge Elimination System, which limits the direct discharge of pollution from factories and other sites into waterways.
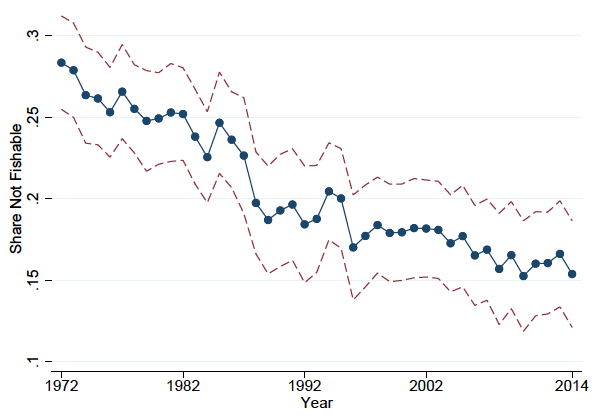
Research has found that both the municipal grants programme (Keiser and Shapiro 2019b) and enforcement of National Pollutant Discharge Elimination System have reduced surface water pollution (Magat and Viscusi 1990, Laplante and Rilstone 1996, Gray and Shimshack 2011). Correspondingly, measures of surface water pollution directly targeted by the Clean Water Act have also fallen steadily since the 1970s (Figure 2).
Figure 2 Share of waters not fishable, 1972 to 2014
Source: Keiser and Shapiro (2019a)
Trends in drinking water quality are harder to document, as limited data is available on concentrations of drinking water pollution. These data are often housed within state environmental agencies and are only collected at the federal level under special monitoring programs.
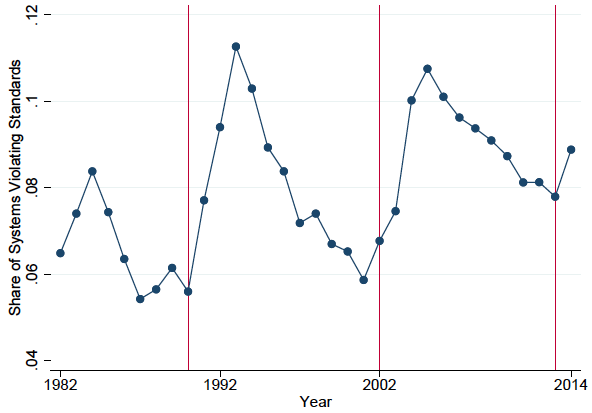
As an alternative measure of drinking water quality, Allaire et al. (2018) analyse violations of drinking water standards governed by the Safe Drinking Water Act. Figure 3 displays the trends that they document over the period 1982 to 2014. These data show that violations increase when standards tighten, and then steadily fall over time. This pattern suggests that drinking water has improved gradually over time, even in the face of tighter standards.
Figure 3 US drinking water quality violations, 1982-2014
Notes: Data are from Allaire et al. (2018). Vertical lines show years of the most important changes in standards (Total Coliform Rule in 1990, Stage 1 Drinking Water Byproducts rule in 2002, and Stage 2 Drinking Water Byproducts rule in 2013). Source: Keiser and Shapiro (2019).
Of course, incidents like the drinking water crisis in Flint, Michigan, are a strong reminder that enforcement of the Safe Drinking Water Act is still far from complete.
How efficient are these efforts?
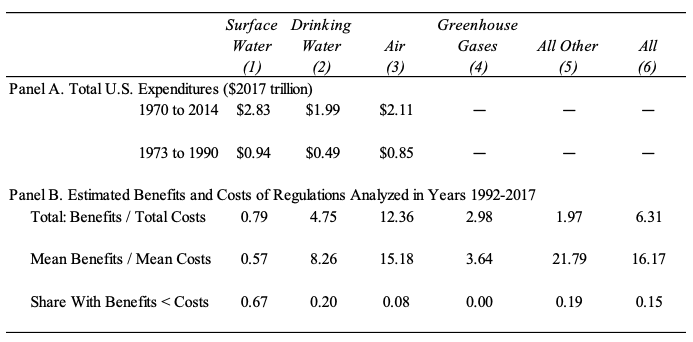
Spending on the Clean Water Act and Safe Drinking Water Act has been enormous. We estimate that public and private investment in surface water pollution control has totalled approximately $3 trillion since 1970. Spending on drinking water pollution control has approached nearly $2 trillion over this same time period. For comparison, spending on air pollution control has exceeded that for drinking water but has been less than that for surface water (Table 1, Panel A).
Table 1 Benefits and costs of federal regulations
Source: Keiser and Shapiro (2019a)
In Table 1, Panel B, we summarise the estimated costs and benefits of 240 environmental regulations implemented over the period 1992 to 2017. The corresponding cost-benefit ratios draw a sharp contrast between regulations for surface water quality and for other purposes. About 67% of these surface water quality regulations fail a cost-benefit study, compared to only 20% of drinking water quality regulations, and 8% of air pollution regulations. These studies reflect government analyses of implemented regulations, but in prior work, we find similar ratios when considering academic studies (Keiser et al. 2019).
The fact that most cost-benefit studies of surface water quality regulations fail is troubling. This is not the case for most environmental regulations. However, we argue that these measured benefits of surface water pollution control may be an underestimate, for several reasons. These benefits often exclude human-health impacts of improved surface water quality, non-use (or existence) values, and benefits that may arise through complicated ecosystem feedback. More favourable cost-benefit ratios for drinking water are consistent with those for air pollution regulations, highlighting the importance of direct human-health impacts from pollution.
Call for research
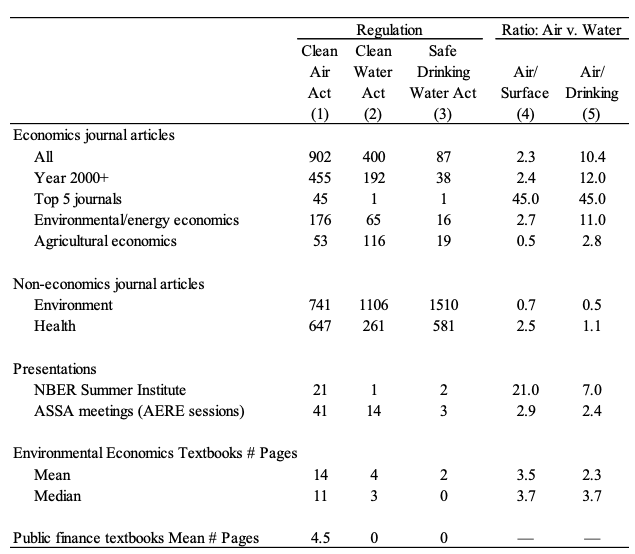
Given the disproportionate amount of funding for protecting surface and drinking water quality, one might expect a similarly disproportionate focus from academics. However, we find that this is not the case. In Table 2, we summarise several ways to measure academic research on surface water and drinking water pollution. This includes counts of academic journal articles, presentations at economic conferences, and textbooks. For comparison, we also examine these measures for air pollution. We find that by nearly all measures, water pollution has been understudied relative to air pollution.
Table 2 Prevalence of economic research on air vs water pollution.
Source: Keiser and Shapiro (2019a)
These findings highlight the need for more research on the full costs and benefits of water quality policies in the US. The recent controversy over the Clean Water Rule only heightens this need.
References
Allaire, M, H Wu and U Lall (2018), “National trends in drinking water quality violations”, Proceedings of the National Academy of Sciences 115(9): 2078–83.
Boyle, K J, M J Kotchen and V K Smith (2017), “Deciphering dueling analyses of clean water regulations”, Science 358:49–50.
Gray, W B, and J P Shimshack (2011), “The effectiveness of environmental monitoring and enforcement: A review of the empirical evidence”, Review of Environmental Economics and Policy 5(1): 3–24.
Keiser, D A, and J S Shapiro (2019a), “US water pollution regulation over the last half century: Burning waters to crystal springs?”, Journal of Economic Perspectives, forthcoming.
Keiser, D A, and J S Shapiro (2019b), “Consequences of the Clean Water Act and the demand for water quality”, Quarterly Journal of Economics 134(1): 349–96.
Keiser, D A, C L Kling and J S Shapiro (2019), “The low but uncertain measured benefits of US water quality policy”, Proceedings of the National Academy of Sciences 116(12): 5262–69.
Laplante, B, and P Rilstone (1996), “Environmental inspections and emissions of the pulp and paper industry in Quebec”, Journal of Environmental Economics and Management 31: 19-36.
Magat, W A, and W K Viscusi (1990), “Effectiveness of the EPA’s regulatory enforcement: The case of industrial effluent standards”, Journal of Law & Economics 33(2): 331-360.
Endnotes
[1] These cases are Rapanos vs. the United States and SWANCC vs. Army Corps of Engineers.
