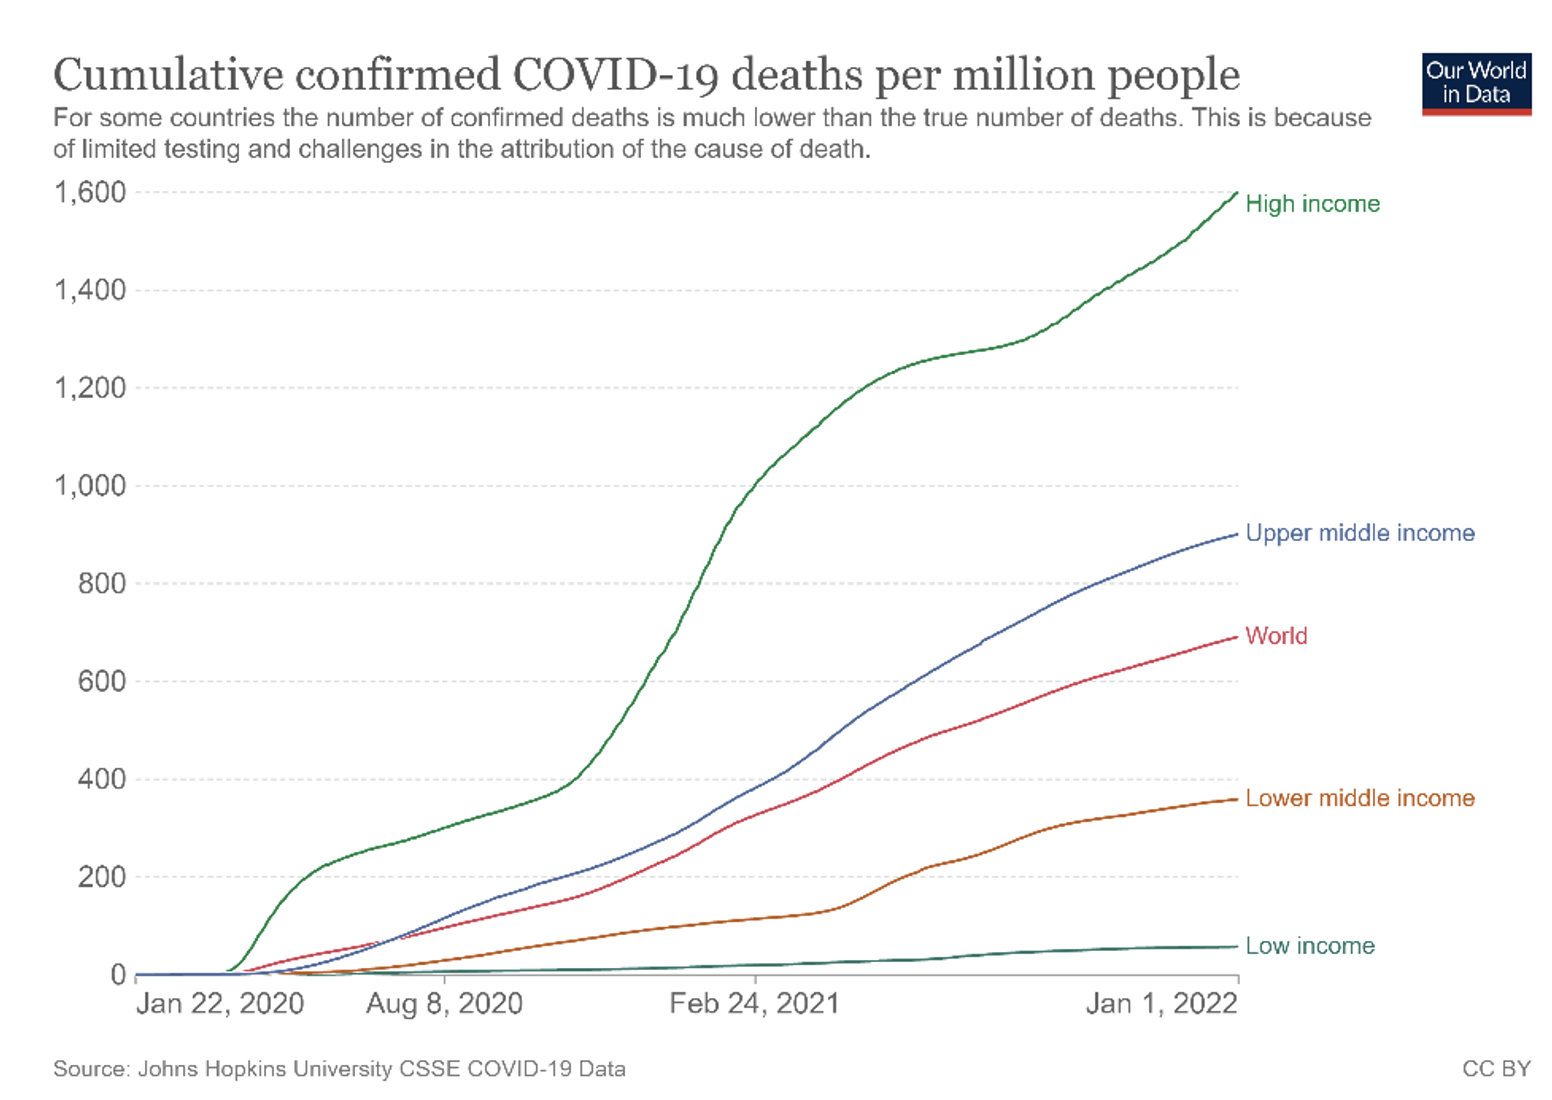
As a benchmark, Figure 1 displays cumulative official Covid-19 deaths per million for high-income, upper-middle, lower-middle, and low-income countries, as well as for the world overall.
Figure 1 Cumulative official Covid-19 deaths per million by income group, 2020-2021
Source: Our World in Data, based on Johns Hopkins University CSSE Covid-19 data.
At first glance, one may conclude that higher-income countries experienced a much worse pandemic. However, recent literature suggests that officially reported mortality may not reflect the true distribution of death tolls, since the limitations of official statistics and data infrastructures vary across the globe (Karlinsky and Kobak 2021, Aron and Muellbauer 2020, Mulligan 2021, and Economist 2021).1 To gain further insight on the data limitations associated with confirmed (i.e. officially reported) Covid-19 counts, we evaluate the quartile ranking of countries using both official and excess Covid-19 mortality data (Aizenman et al. 2022). Contrasting countries’ ranking using these two data sources reveals sharp and systematic contrasts in mortality statistics. In particular, while higher GDP per capita is associated with a worse mortality ranking (i.e. a quartile with higher mortality), using the official Covid-19 mortality data, there is no such association in the excess mortality data.
Figure 2 plots the world excess and the official Covid-19 deaths during the first two Covid-19 years. It vividly shows the higher mean and standard deviation of the excess in comparison to the official deaths.
Figure 2 Global estimated excess deaths and official Covid-19 deaths, 2020-2022
Source: The Economist, 4 February 2022.
To gain further insight, we perform two sets of regressions, in which the ratio of cumulative excess to official Covid-19 mortalities (E/O ratio) is regressed on a large set of covariates. We focus on more than 140 countries with cumulative excess mortality higher than the official one, and the analysis is run both at the end of 2020 and the end of 2021. In the first, ‘narrow’ experiment, we control only for GDP per capita and vaccination rates. In the second, ‘broad’ experiment, we add other institutional and policy variables. In the narrow experiment we find that by December 2021, cumulative excess/official Covid-19 mortality ratios are smaller for countries with higher vaccination rates. In the broad experiment – both at the end of 2020 and at the end of 2021 – a higher urban population share and a higher score on voice and accountability are associated with lower cumulative excess/official Covid-19 mortality ratios, but the vaccination variable at the end of 2021 becomes insignificant – probably due to multicollinearity with the other controls.
Contrasting the quartile rankings between official and excess mortality
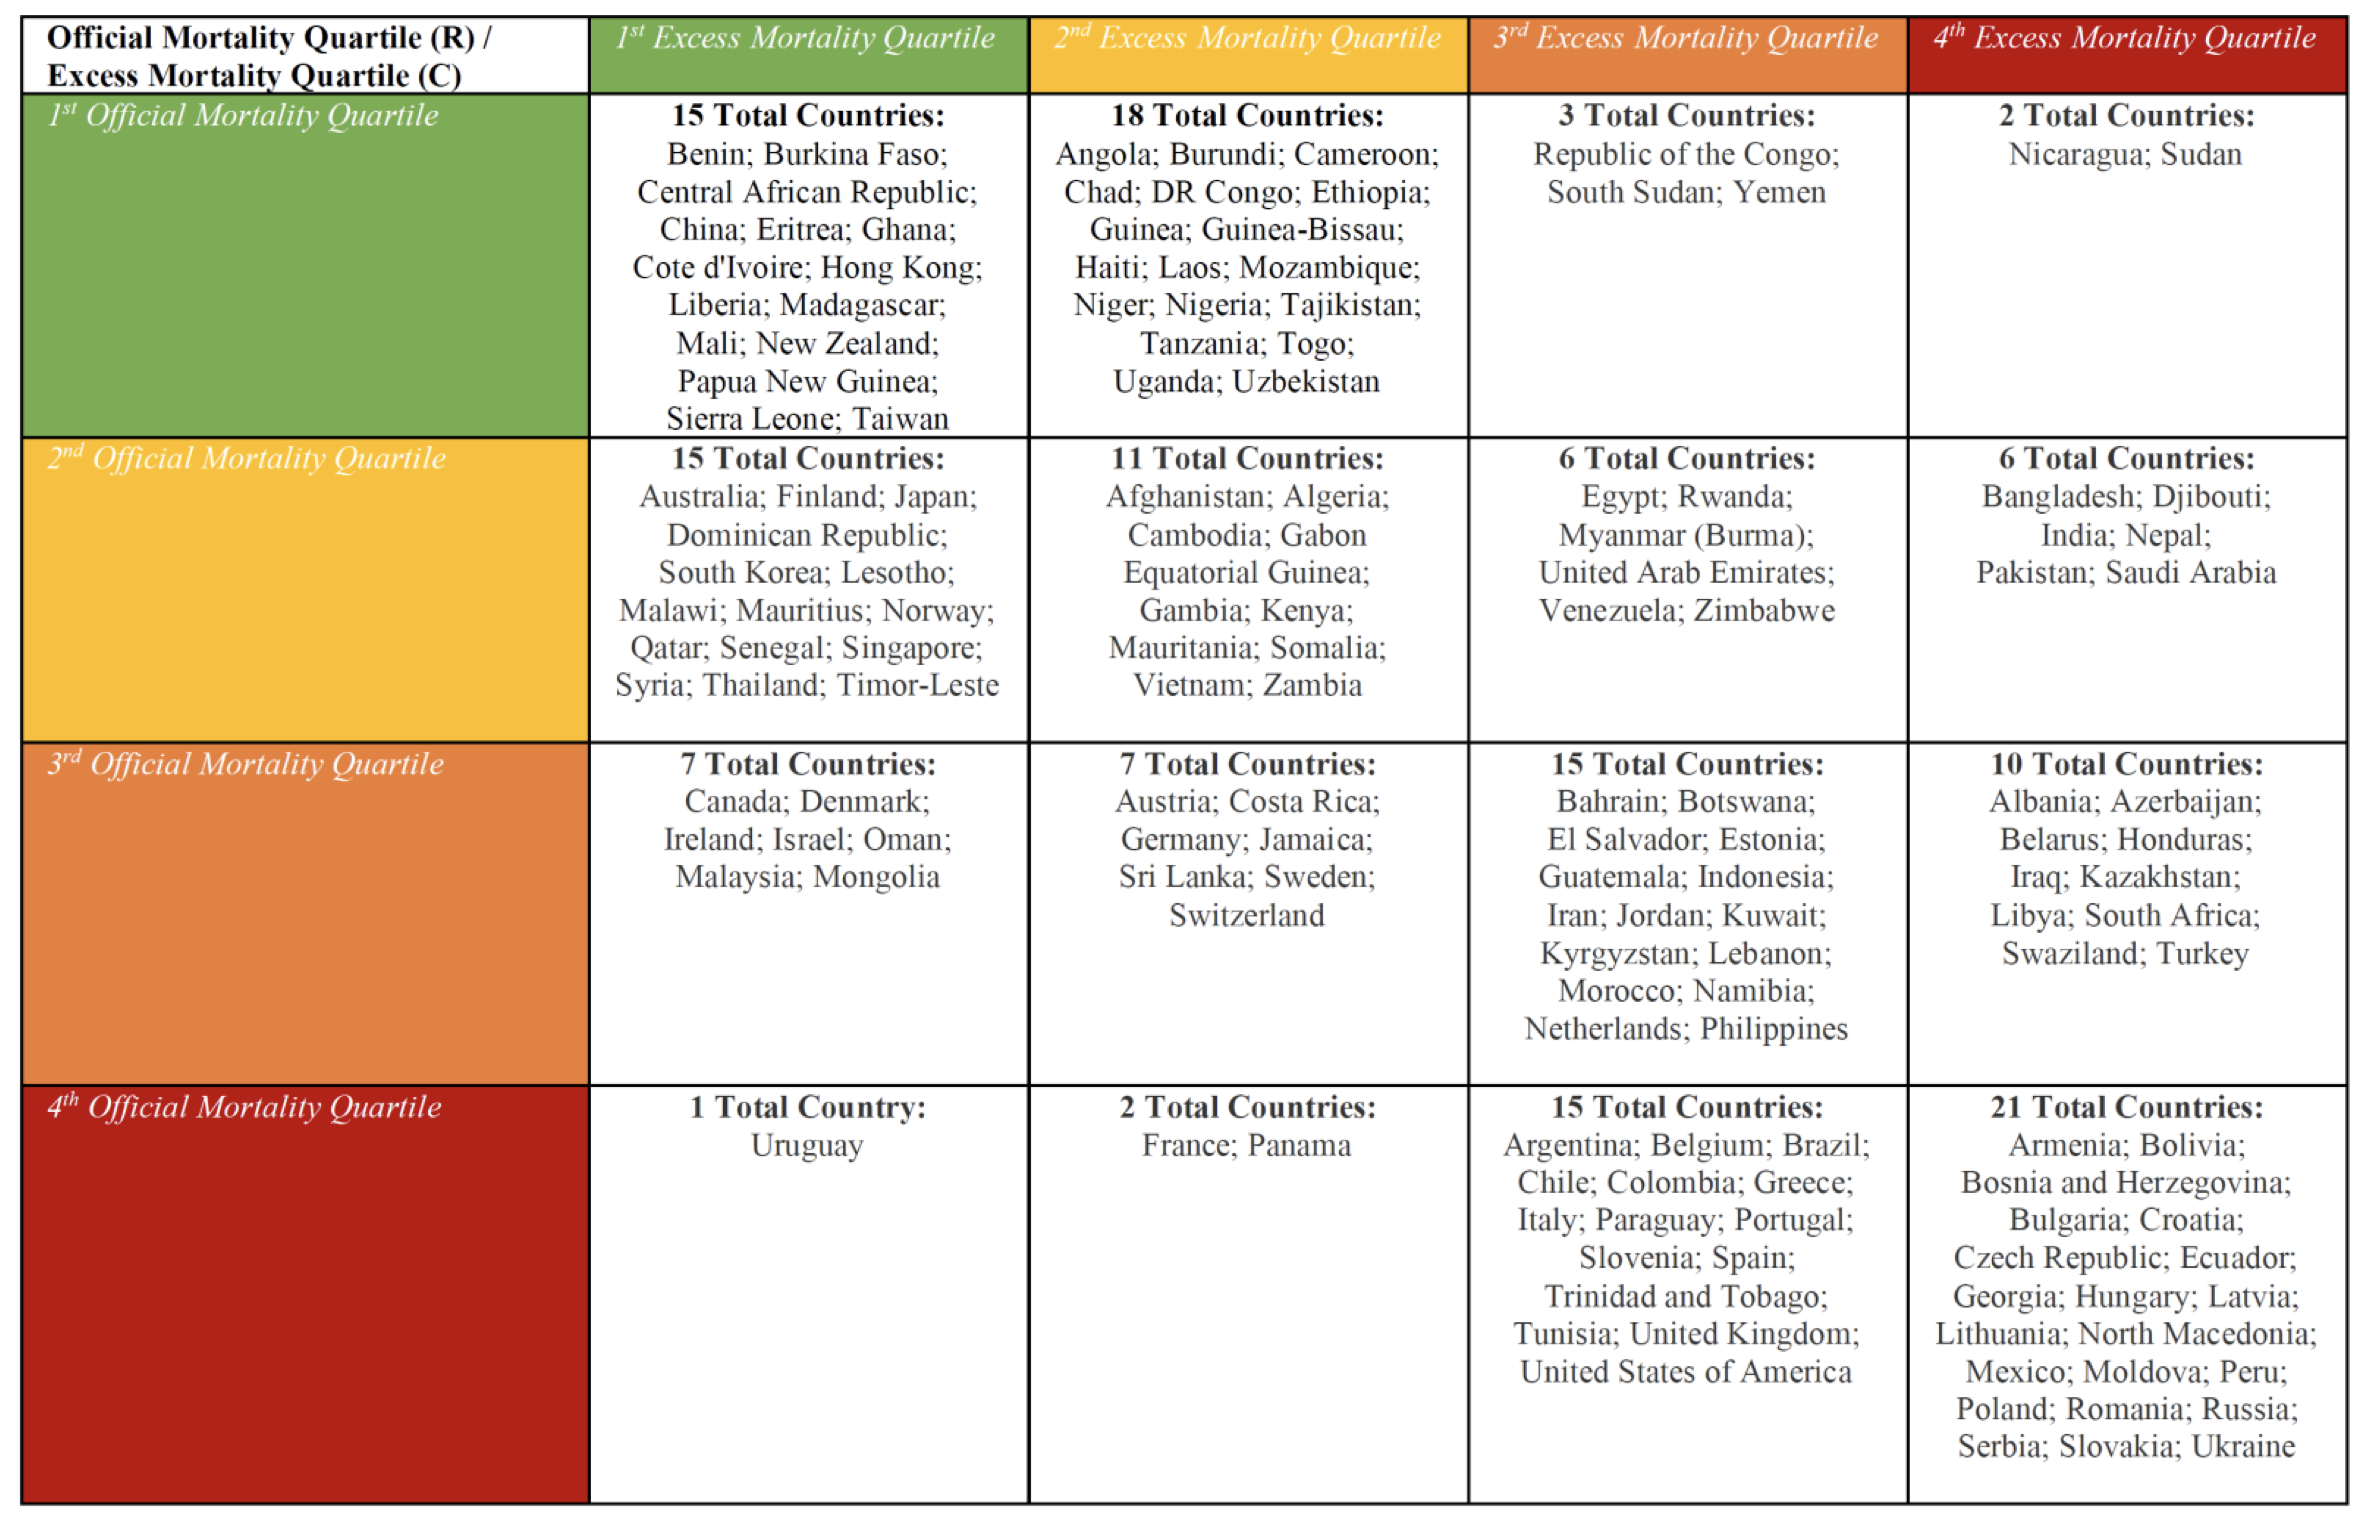
Taking a more detailed look we compare the quartile rankings between official and excess mortality at the end of 2021. For three fifths of the countries in our sample, quartile rankings differ between the two data sets (e.g. a nation will have a quartile ranking of three based on the official mortality data, but a ranking of one based on the excess mortality data). Details appear in Table 1.
Table 1 Country official mortality quartile against excess mortality quartile
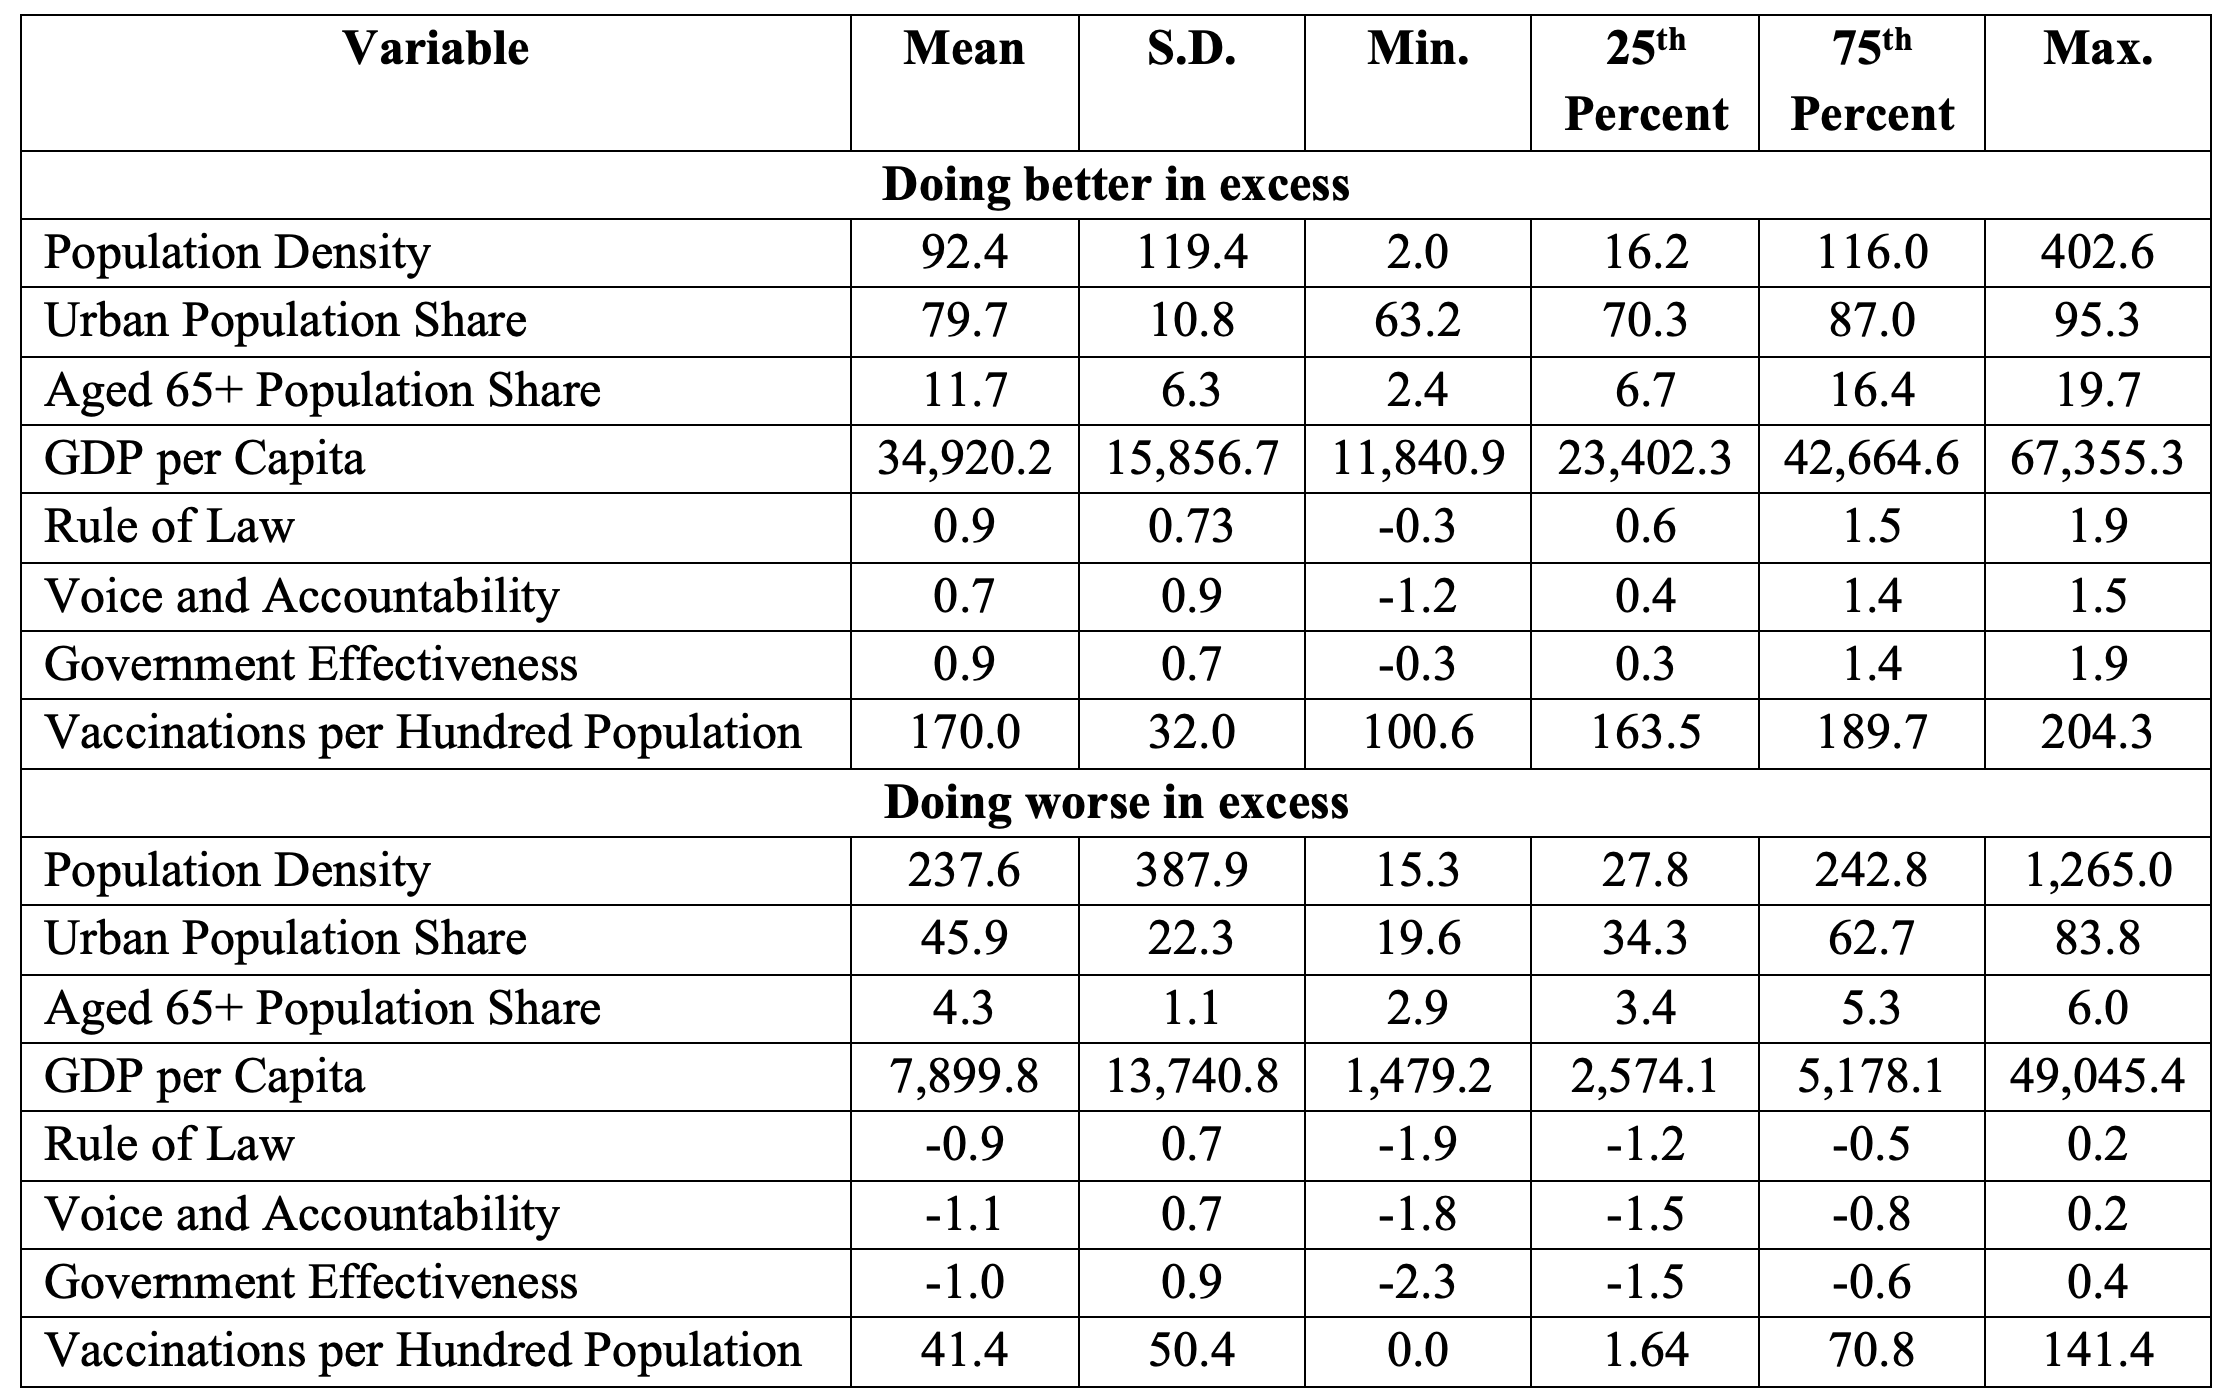
Table 2 reports the average statistics for countries that are ‘doing substantially worse in excess’ – any countries that recorded a quartile ranking at least two worse (i.e. higher mortality) when using excess mortalities as opposed to official mortalities (e.g. Bangladesh) – and comparing them to countries that are ‘doing substantially better in excess’ – any countries that recorded a quartile ranking at least two better (i.e. lower mortality) when using excess mortalities as opposed to official mortalities (e.g. France). When contrasting countries that are ranked substantially better to countries that are ranked substantially worse in excess mortality as opposed to official mortality, we find that, on average, the ‘doing substantially better in excess’ countries (1) have lower density (90 versus 240), are older (12% versus 4% of aged 65 and older); (2) record a substantially higher GDP per capita ($35,000 versus $8000); (3) score better in rule of law, voice accountability, and government effectiveness; and (4) achieve substantially higher vaccination rates, as measured by the number of Covid-19 vaccinations administered per hundred population (170 versus 40).2
Table 2 Summary statistics of ‘doing better in excess’ deaths and ‘doing worse in excess’ deaths3
These gaps support the view that better governance scores account for the countries with the largest gaps between excess and official mortality. Notably, these characteristics are also associated with higher GDP per capita, older populations, and, in some experiments, with sufficiently high vaccination levels. The overall positive correlations between these variables suggests that without more granular data, ranking the relative importance of these factors is not possible.
Concluding remarks
As the Covid-19 pandemic has caused significant death tolls globally, cross-country analyses and global comparisons have been widely conducted to investigate Covid-19 mortality across many dimensions (economic, political, social, etc.). With most of these studies relying on official statistics on Covid-19 mortality as reported by countries, the quality of the underlying official mortality statistics plays a critical role in affecting the results obtained. Importantly, there are widely documented limitations in the official mortality statistics that mask the ranking of countries in terms of life preservation. Some of these limitations include differences in countries’ capacities to test for Covid-19, determine the cause of death, and disparate definitions of death due to Covid-19.
To investigate the limitations of official Covid-19 mortality, we contrast this measure with excess mortality, which is calculated as the difference of all-cause mortality during the Covid-19 pandemic from a baseline trend modeled from historical mortality data. We show that countries’ quartile rankings differ quite substantially between excess and official cumulative mortality. Countries that fare best in terms of cumulative excess mortality record the highest income and institutional quality (as measured by rule of law, voice and accountability, and government effectiveness), and countries faring the worse in terms of cumulative official mortality share similar characteristics. This evidence is further supported by a simple regression analysis of the ratio of excess to official mortality on country-specific indicators as well as a deeper examination of quartile movements of individual countries between measures of official and excess mortality. Specifically, governance variables (e.g. voice and accountability) and other structural variables (such as urban population share) explain the ranking gaps between the two data sets.
These results suggest that one should take the official Covid-19 mortality counting with some skepticism and that it should be supplemented by excess mortality data.4 However, it should be noted that excess mortality data is also subject to limitations that may affect its quality. Indeed, some limitations of the official mortality statistics have been mitigated, and therefore, the results in this paper may not solely be attributed to the quality of official mortality statistics (see Whittaker et al. 2021, Helleringer and Queiroz 2021).5 Notably, the growing importance of GDP per capita and vaccination rates in explaining the cross-country variation of the cumulative excess/official Covid-19 death ratios at the end of 2021 is in line with World Health Organisation (WHO) concerns about the global shortages of vaccinations, resulting in unequal worldwide vaccination rates.
This study has limitations. First, to maximise the sample size, we rely on the mid-point estimates of excess deaths, whose upper and lower bounds vary with the underlying data and models (see Adam (2022) for comparisons). Second, our estimation focuses on contrasting Covid-19 excess and official deaths and their linear associations with several controls in a non-experimental setting. Third, the types of vaccination and the variants of concern, both of which have evolved with the pandemic’s path, are nuances in the relationships of variables studied. Due to current data limitations, they are currently beyond the scope of our analysis.
References
Adam, D (2022), “The pandemic’s true death toll: millions more than official counts”, Nature 601: 312-315.
Aizenman, J, A Cukierman, J Jinjarak, S Nair-Desai and W Xin (2022), “A Two Covid-19 Years Quartile Comparison of Official with Excess Mortality: Voice and Accountability and the Impact of Vaccines”, NBER Working Paper No. 29778, February..
Aron, J and J Muellbauer (2020), “The US excess mortality rate from COVID-19 is substantially worse than Europe’s”, VoxEU.org, 29 September.
Aron, J, J Muellbauer, C Giattino and H Ritchie (2020), “A pandemic primer on excess mortality statistics and their comparability across countries”, Guest post, Our World in Data, University of Oxford, 29 June.
Beyer, R, Y Hu and J Yao (2022), “Measuring Quarterly Economic Growth from Outer Space”, Data on Covid-19 (coronavirus) by Our World in Data, Accessed: 3 Feb 2022.
Economist (2021), “There have been 7m-13m excess deaths worldwide during the pandemic”, The Economist, 12 May.
Economist (2022), “Autopsies and Covid-19: America’s elected coroners are too often a public-health liability - The politics of death”, 29 January.
Hale, T, N Angrist, R Goldszmidt, B Kira, A Petherick, T Phillips and others (2021), “A global panel database of pandemic policies (Oxford COVID-19 Government Response Tracker)”, Nature Human Behaviour 5(4): 529-538.
Helleringer, S and B L Queiroz (2021), “Measuring excess mortality due to the Covid-19 pandemic: progress and persistent challenges”, International journal of epidemiology.
Karlinsky, A and D Kobak (2021), “Tracking excess mortality across countries during the Covid-19 pandemic with the World Mortality Dataset”, Elife 10, e69336.
Kaufmann, D, A Kraay and M Mastruzzi (2011), “The worldwide governance indicators: Methodology and analytical issues”, Hague journal on the rule of law 3(2): 220-246.
Mathieu, E, H Ritchie, E Ortiz-Ospina et al. (2021), “A global database of Covid-19 vaccinations”, Nat Hum Behav.
Mulligan, C (2021), “Deaths of despair and the incidence of excess mortality in 2020”, VoxEU.org, 28 January.
Whittaker, C, P G Walker, M Alhaffar, A Hamlet, B A Djaafara, A Ghani and others (2021), “Under-reporting of deaths limits our understanding of true burden of Covid-19”, bmj 375.
Endnotes
1 Notably, countries have different levels of reporting and testing availability, or disparate definitions of Covid-19 deaths. This is due to the different abilities of medical systems to capture the totality of Covid-19 deaths.
2 The association of higher share of aged 65+ with ‘doing better’ may reflect higher life expectancy in countries where the older population affords retirement and greater isolation, and higher vaccination rates by the end of 2021.
3 Note: ‘Doing substantially better in excess’ is the sample of countries that recorded a ranking at least two better quartiles (i.e. quartiles with lower cumulative mortality) when using excess rather than official mortalities, and ‘doing substantially worse in excess’ is the sample of countries which recorded a ranking at least two worse quartiles (i.e. quartiles with higher cumulative mortality) when using excess rather than official mortalities.
4 First, the infrastructure needed and capacity to register and report all deaths varies across countries. Second, there are delays in death reporting that make mortality data provisional and incomplete. The extent of the delay and counting capacity varies by country. See Aron et al. (2020) and Adam (2022).
5 The precision of official Covid-19 mortality statistics is subject to how well-resourced the medical system is, which tends to vary across countries and is likely to improve with learning-by-doing and the mobilisation of public resources to the system. Challenges to the official mortality statistics include whether Covid-19 was the cause of death. Such determination is subject to the quality of, among other, the medical-examiner system and the coroner system. More generally, countries have different systems of issuing death certificates, that involve technocrats, elected officials, and physicians. In the case of Covid-19, the quality of autopsies matters greatly as symptoms of acute respiratory distress inflammatory responses signaling a viral infection needs to be sorted into Covid-19 induced deaths and deaths due to other reasons. See also The Economist (2022).


