Around the world, COVID-19 vaccines are being rolled out. Vaccines are clinically proven to reduce the transmission of COVID-19 and, more importantly, avoid millions of hospitalisations and deaths. At the same time, vaccines can affect economic activity both directly, as consumers and workers feel confident they can shop and go to work without catching COVID-19, or indirectly, by allowing governments to relax restrictions that hamper economic activity. This has led some observers to conjecture the return of the ‘Roaring Twenties’ as consumers go back to the shops and workers to their offices (Terzi 2021).
So what is the economic effect of vaccines? If vaccines are successful in restarting the economy, it is likely to show up in higher spending, higher mobility, and lower unemployment claims. We estimate the effect of higher vaccination rates on these variables using high-frequency data at the county level in the US during 2021. Previous studies have studied the question using an epidemiological model (Sandmann and others 2021), or cross-country (Deb et al. 2021) or regional data (Granslmeier et al. 2021) at high frequency.1
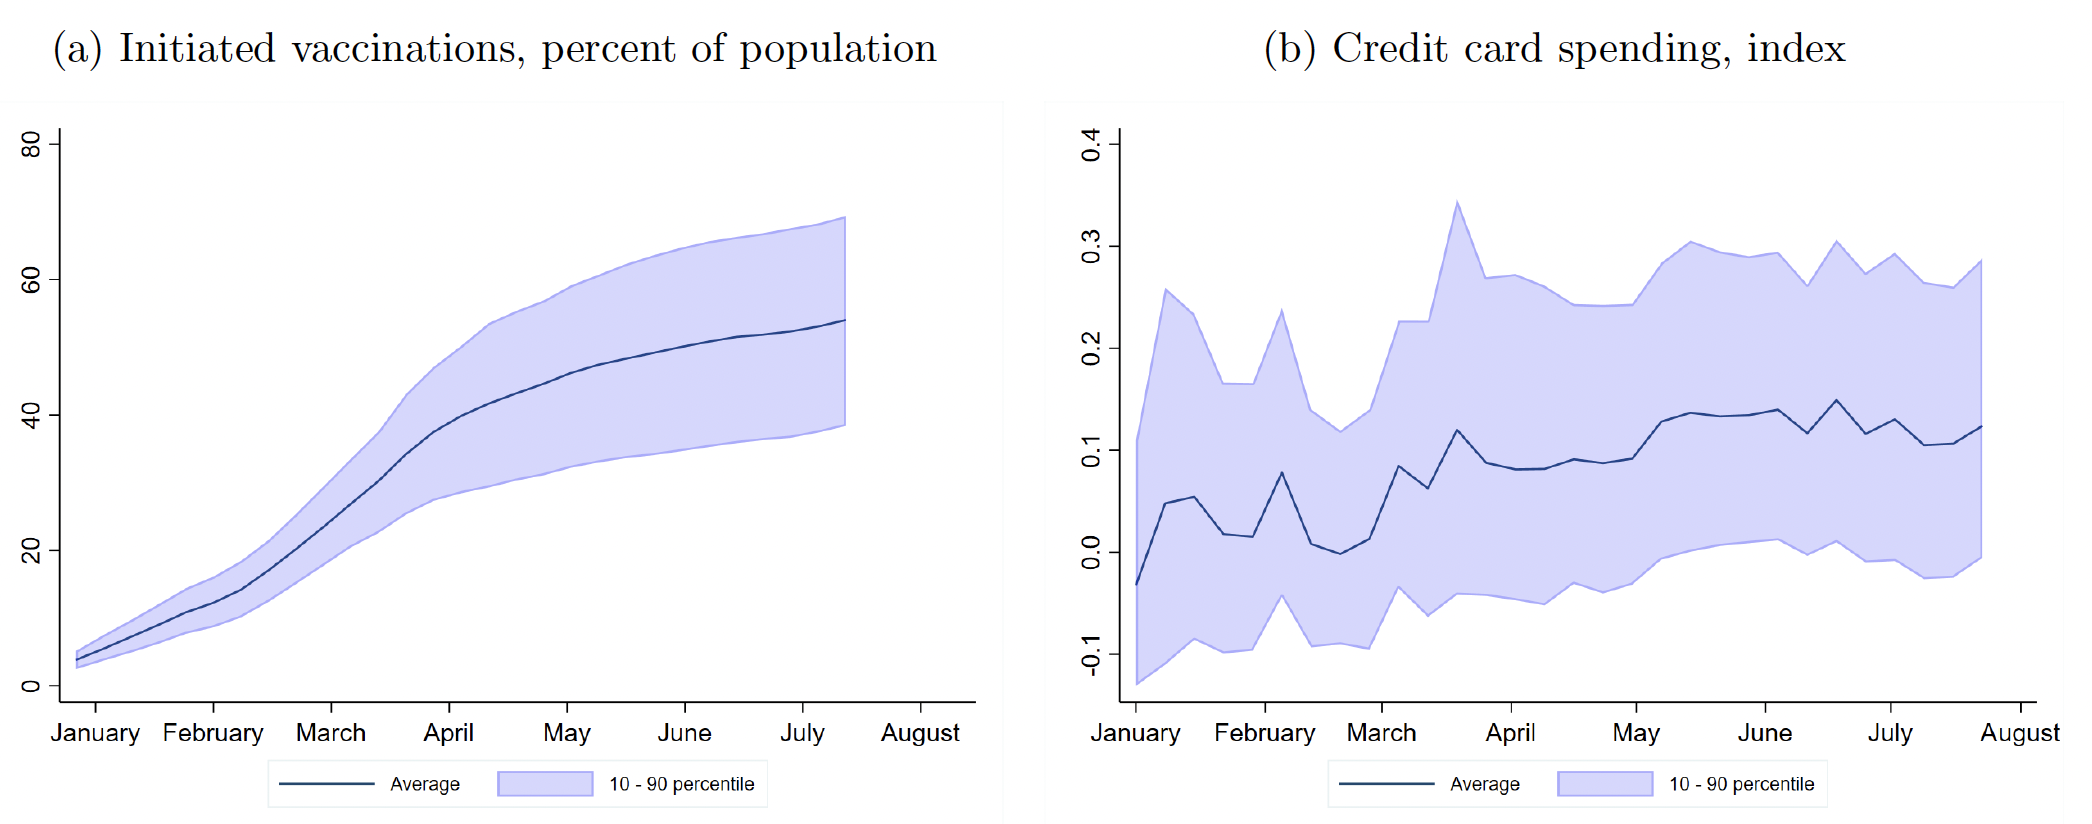
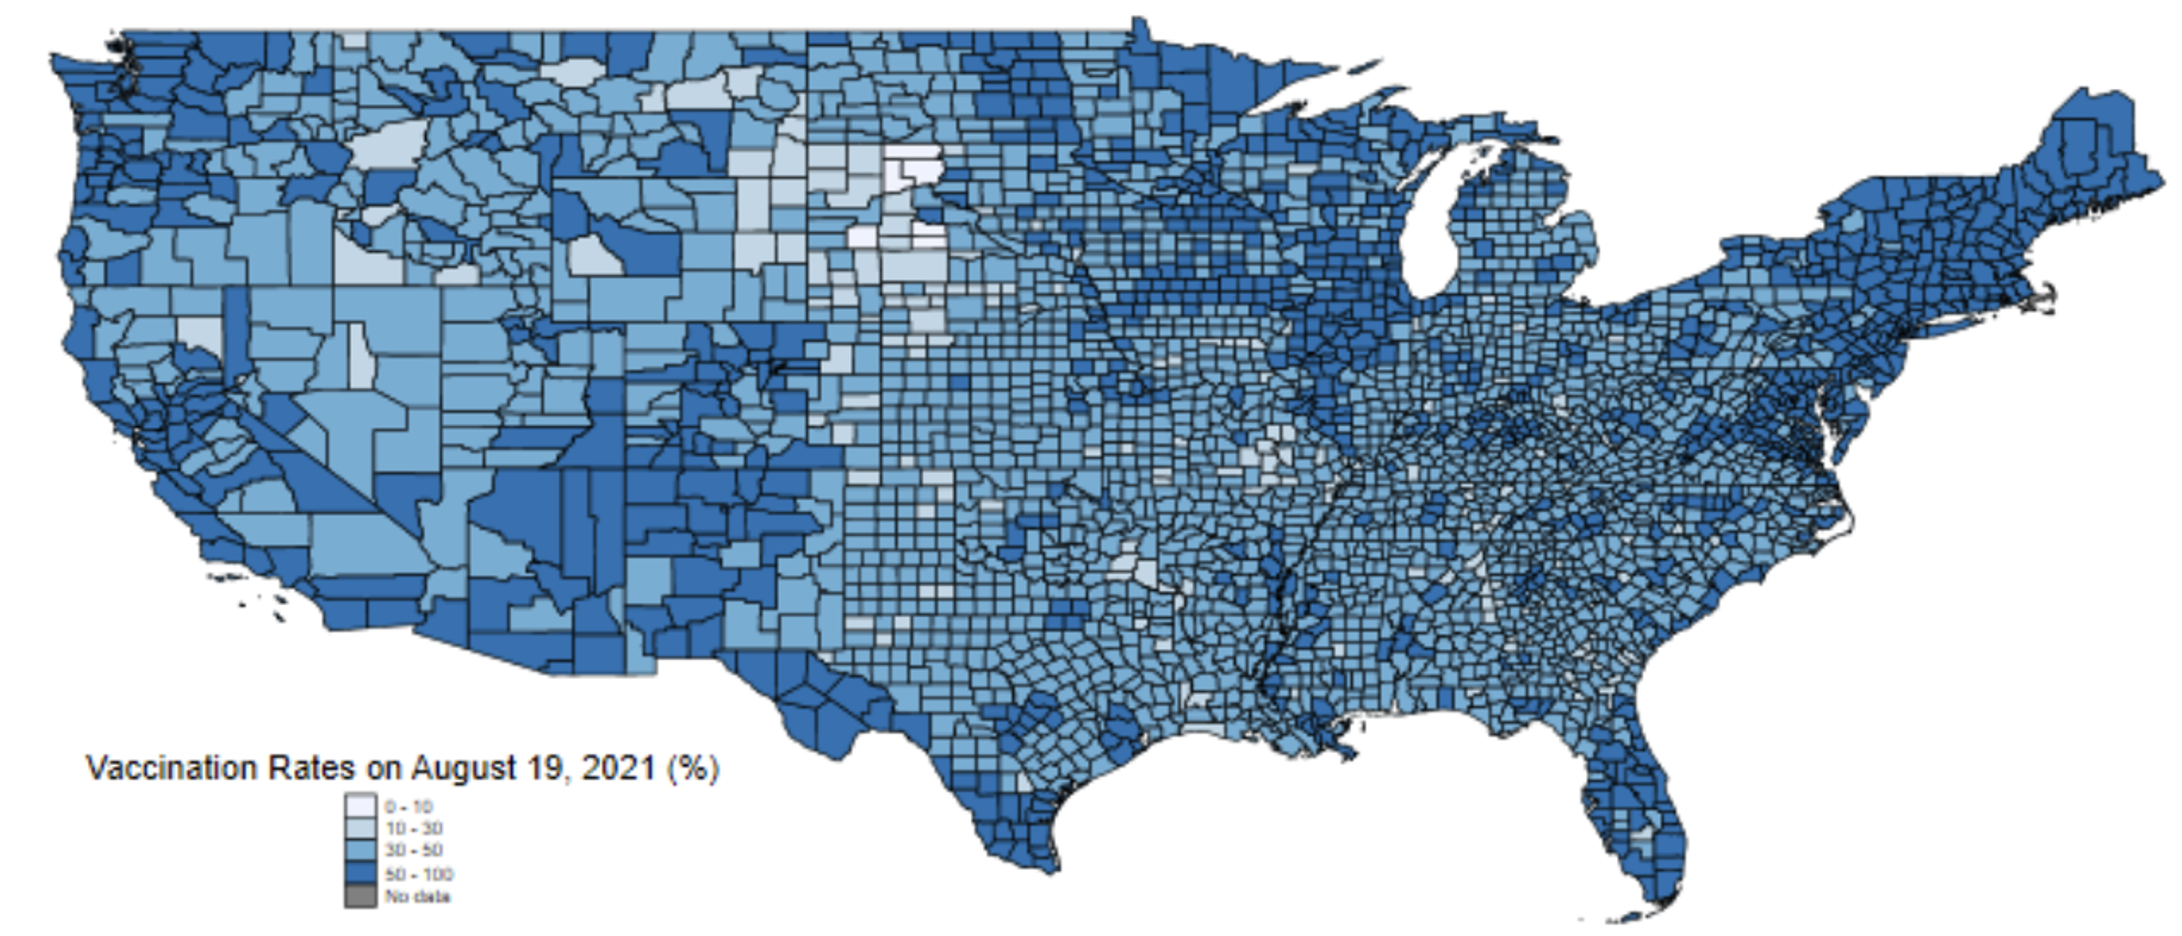
The experience in the US during 2021 provides precious data for identifying the effect of vaccination programs. In the United States, the vaccination rollout started in December 2020 and accelerated over the winter and spring of 2021 before decelerating in the early summer. By 13 August 2021, the average US county had a share of initiated vaccinations (i.e. first doses taken to population) of 56.0% (Figure 1, Panel A). During the same period, the economy continued rebounding as witnessed by increasing credit card spending (Figure 1, Panel B). There was, however, substantial variation around the rollout of vaccines across counties, with the 10th and 90th percentiles exhibiting 40.4% and 71.7% initiated vaccination rates, respectively. This point is further highlighted in Figure 2, which shows the full distribution of vaccination rates across counties within the US on 19 August 2021.
Figure 1 Vaccinations and economic activity, 2021
Source: Chetty et al. (2020); Centers for Disease Control and Prevention; authors’ calculations.
Notes: Initiated vaccinations are first doses of vaccines taken. Spending is seasonally adjusted credit/debit card spending expressed relative to 4–31 January 2020.
Figure 2 Vaccination rates across US counties
Source: Authors’ calculations.
However, getting credible estimates of the causal effect of vaccines is not trivial. First, a critical worry is reverse causality bias. For example, imagine that a county is hosting a public event and thus facilitates the access to vaccines in the run-up to the event. A researcher looking at these data and without the context could be tempted to conclude that vaccines cause economic activity, but in this case the relationship goes in the opposite direction – economic activity caused higher vaccination rates. Second, the relationship may be spurious if a third underlying factor is driving both vaccination rates and economic activity. For example, concerns about the state of the pandemic would drive up vaccine uptake and reduce economic activity, again clouding the causal relationship.
Methodology
In recent work (Hansen and Mano 2021), we propose an instrumental variables approach to address these concerns. Specifically, we propose an instrument that proxies for the exogenous supply of vaccines and thus can be used to get credible estimates. Our instrument is the pre-determined pharmacy density at the county level (number of pharmacies per square mile) interacted with weekly allocated vaccines at the state level.2 That way, the approach exploits variation in whether economic activity picks up more in counties with higher pharmacy density when vaccines are allocated to the given state. We believe this is a good instrument for two reasons. First, counties with higher pharmacy densities can better push vaccines to their population when more vaccines are allocated to the state, a fact borne out by the data. Second, our instrument arguably also satisfies the exclusion restriction as the pharmacy density is pre-determined and with no direct impact on economic activity besides through vaccination. Indeed, we show that the relationship of vaccines with the level of pre-vaccination spending is insignificant.
Findings
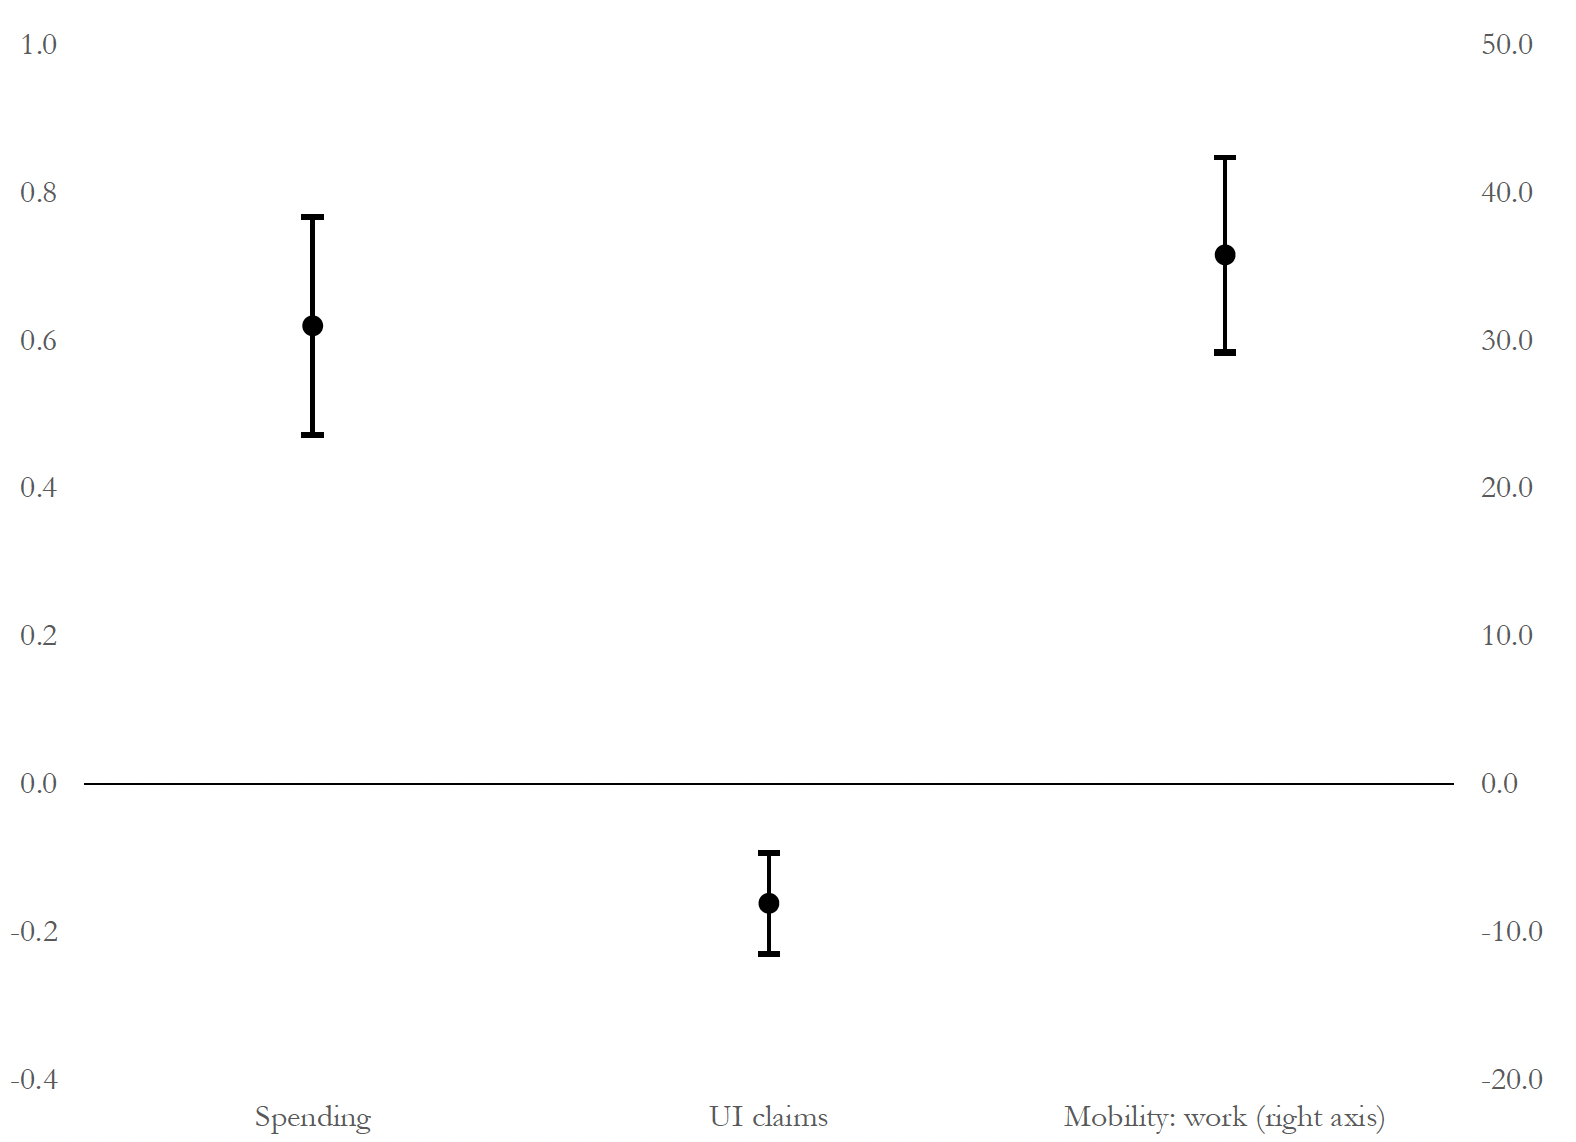
Using the methodology laid out above, we find that vaccines have proven to be a significant and substantial shot in the arm for the economy. Specifically, an additional 1 percentage point in initiated vaccination rates increases weekly credit card spending by 0.6 percentage points and reduces initial unemployment claims by 0.2 percentage points of the 2019 labour force (Figure 3). We also find evidence that vaccination increases work-related mobility. Importantly, the estimated effects vary across counties, with larger effects of vaccinations in urban counties and in counties with worse socioeconomic conditions (Table 1). This way, vaccinations are also a fair shot in the arm for the economy, which highlights that equitable distribution of vaccines is important to reduce inequality.
Figure 3 Effect of a one percentage point increase in initiated vaccination rates on economic activity at the county level (left axis: percentage points; right axis: percent)
Notes: The figure shows the estimated effect (and 90% confidence interval) of initiated vaccination rates on spending (left axis), UI claims (left axis), and work-related mobility (right axis). Spending is seasonally adjusted credit/debit card spending expressed relative to 4–31 January 2020, expressed in percentage points. Workplace mobility is compared to its median value for the same weekday in the period of 3 January – 6 February 2020, expressed in percentage points. UI claims is annualized initial unemployment insurance claims in percent of the 2019 labour force.
Source: Table 4 in Hansen and Mano (2021).
Table 1 Effect of vaccination conditional on county-level characteristics
Notes: Table show the sign and significance of the initiated vaccination rate interacted with the relevant county characteristics. "High unemployment" indicates whether the relevant county's initial unemployment rate is above the median across all countries. "Low educational attainment" indicates whether the relevant county's initial population share with bachelor levels below the median across all countries. ***, **, and * indicate statistical significance at 1%, 5%, and 10%, respectively.
Source: Table 5 in Hansen and Mano (2021).
Aggregating our estimates to the whole country, the vaccine rollout up to August 2021 added 0.27 percentage points to 2021 US GDP growth through the direct effect on consumption alone. We build this estimate bottom-up by computing the effect on consumption in each county, converting this effect into a GDP contribution, and then aggregating up across all counties. The overall effect on GDP could be larger insofar as the vaccination rollout has additional indirect effects, such as higher investment as a response to increased consumer confidence.
Implications
Our results hold important lessons for other countries even though they are based on data from the US. First, the US rolled out vaccines early and at a large scale, which makes it a good case study for those that had later rollouts. Second, our results highlight that ensuring an equitable distribution of vaccines is critical to reducing inequality, either pre-existing or pandemic-induced.
Authors’ note: The views expressed in this column are those of the authors and do not necessarily represent the views of the IMF, its Executive Board, or IMF management.
References
Chetty, R, J N Friedman, N Hendren, M Stepner and the Opportunity Insights Team (2020), “The economic impacts of COVID-19: Evidence from a new public database built using private sector data”, NBER Working Paper 27431.
Deb, P, D Furceri, D Jimenez, D Kothari, J D Ostry, and N Tawk (2021), “The Effects of COVID-19 Vaccines on Economic Activity”, IMF Working Paper 2021/248.
Ganslmeier, M, P Deb, D Furceri, J Ostry, and N Tawk (2021), “Vaccinate Early and Vaccinate Broadly: On the health and Economic Effects of COVID-19 Vaccines”.
Guadamuz, J S, G Caleb Alexander, S N Zenk, and D M Qato (2020), “Assessment of Pharmacy Closures in the United States From 2009 Through 2015”, JAMA Internal Medicine 180(1): 157–160.
Hansen, N-J H and R C Mano (2021), “COVID-19 Vaccines: A Shot in Arm for the Economy”, IMF Working Paper 2021/281.
Sandmann, F G, N G Davies, A Vassall et al. (2021), "The potential health and economic value of SARS-CoV-2 vaccination alongside physical distancing in the UK: a transmission model-based future scenario analysis and economic evaluation", The Lancet Infectious Diseases 21(7): 962-974.
Terzi, A (2021), “The ‘Roaring Twenties’: Revisiting the evidence for Europe”, VoxEU.org, 2 April.
Endnotes
1 Ganslmeier et al. (2021) employs an instrumental variable approach using previous vaccine procurement interacted with region-time fixed effects.
2 The number of pharmacies is obtained from the NCPDP dataset aggregated to the county level in 2020 from Guadamuz et al. (2020), We are grateful to Dima Mazen Qato, who kindly updated and provided these data.

