Over the past few years, a growing number of economists have been arguing that a new era has started – one characterised by unprecedentedly low interest rates and affordable credit.1 As a result, both academics and policymakers have been looking into possible disruptive effects inherent to this evolution. For instance, Mian and Sufi (2009), Favara and Imbs (2015) and Di Maggio and Kermani (2017) have shown that easy access to credit is at the root of the 2000s housing price boom. Similarly, Jorda et al. (2015) and Brunnermeier and Schnabel (2016) have related credit provision to equity market booms and busts. While the positive relation between credit and asset prices has been widely documented, the channel through which credit fuels prices is still unclear.
On the one end, the discount rate channel, predicts that cheap credit reduces the cost of capital without trading, deviations from fundamental values or wealth transfers among traders. On the other extreme, the extrapolation channel predicts the opposite: naive extrapolators lose money because they use credit to ride (and thereby fuel) the bubble unsuccessfully (Fischer 1933, Galbraith 1955: 46-50, Kindleberger 1978, Barberis et al. 2018). In between the extremes, we find mechanisms with mixed implications; for example, loan holders could successfully ride the bubble, as in Abreu and Brunnermeier (2003), or borrow from traders with more pessimistic priors about the security's payoffs as in Geanakoplos (2010) or Simsek (2013).
In a new paper (Braggion et al. 2020), we bring these theories to the data by studying margin loan provisions in the London equity market during the 1720 South Sea episode, a financial boom and crash that is widely considered as a classical example of an asset bubble. In the early run-up phase of the bubble, the Bank of England opened a facility allowing its shareholders to borrow money by collateralising their shares in the Bank.2 The loan facility provided credit at a 4% annual interest rate, which was well below the rates given by brokers.3 For three major British companies – the Bank of England, East India Company and Royal African Company – we hand-collect every single equity transaction and margin loan with unique buyer, seller and borrower identities. The three companies represent about 50% of the market in terms of pre-bubble capitalization. We link the trading and loan data to the complete list of subscribers of new share offerings initiated by the South Sea Company and London Assurance company at prices well above their market valuations.
Our data have the scope and level of detail to precisely outline the mechanism that relates credit provision to trading behaviour. First, our main information source consists of trader-specific ledger accounts, which record trader and borrower identities. To give an idea of the type of data used, we provide a snippet in Figure 1 showing the sales records of John Myster. It details the number of shares he sells, the dates of the sales and the counterparties of his trades. Figure 2 shows that John Myster takes a margin loan from the Bank of England. As shares were given as collateral to the bank, the loan is also recorded in the sales ledger as a fictitious sale to John Hanger, one of the directors of the Bank (see the red box in Figure 1). Since loans and trades are recorded in the same ledger account, we see each trader's exact daily loan position and share trades.
Figure 1 John Myster’s stock sales
Figure 2 John Myster’s Bank of England loan
Second, we observe traders’ behaviour across firms and hence we can control for company-specific events and changes in the macroeconomic environment. Third, the large and representative market coverage allows us to make general statements about the relationship between debt, trading strategies and asset prices.
As a first take to the data, we study the characteristics of investors taking a Bank of England margin loan. We find that physical proximity to the market, trading experience and trading frequency are important determinants of the propensity to take a loan. In particular, investors that do no trade before 1720 and investors who are in the top percentile of the trading frequency distribution are more likely to take a loan. We also find that shareholders living close to the market are significantly more likely to collateralise their shares.
When we analyse trading behaviour, we find that investors with margin loans behave as extrapolators, that is, they are more likely to buy (sell) following days of high (low) share returns. For instance, in the spring of 1720, loan holders are approximately 65% more likely to buy shares vis-a-vis other traders. Consistent with these results, margin loan holders are also twice as likely to subscribe to new share offerings when these shares trade at peak prices (six to eight times pre-bubble quotes). Even without taking returns on these share subscription into account, loan holders incur large trading losses. A margin loan holder realizes a 14 to 23 percentage point lower return than the average investor. This figure corresponds to a large wealth transfer from loan holders to other investors. In additional tests, we show that our findings cannot be explained by asymmetric information among investors (Brennan and Cao 1997), investors' portfolio rebalancing (Bian 2019) or destabilizing short selling (Lamont and Stein 2004, Hong et al. 2012).
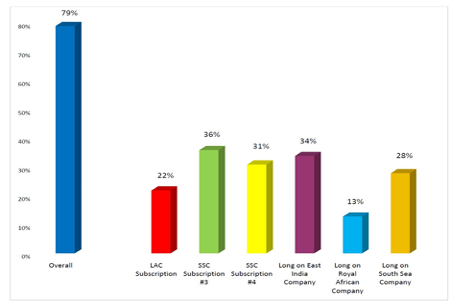
As we show in Figure 3, about 79% of the Bank of England loan capital is used to take speculative positions. In particular, each company subscription attracts more than 20% of the loan capital. Similarly, more than 30% of loan capital is invested in the East India Company on its peak date.4
Figure 3 Percentage of Bank of England loan holders taking speculative positions
Our results provide a detailed account of the use of margin credit and its relationship with trading behaviour. They suggest that the central banks should carefully consider asset prices when defining monetary policy, since lower interest rates, as well as cheaper credit, can have a material impact on investors’ trading behaviour and wealth transfer among investors.
References
Abreu, D, and M Brunnermeier (2003), “Bubbles and crashes”, Econometrica 71, 173-204.
Barberis, N, R Greenwood, L Jin, and A Shleifer (2018), “Extrapolation and bubbles”, Journal of Financial Economics 129, 203-227.
Bian, J, Z Da, D Lou, and H Zhou (2019), “Leverage network and market contagion”, Working Paper.
Braggion, F, R Frehen, and E Jerphanion (2020), “Does credit affect stock trading? Evidence from the South Sea Bubble”, CEPR Discussion Paper no. 14532.
Brennan, M, and H H Cao (1997), “International portfolio investment flows”, Journal of Finance 52, 1851-1880.
Brunnermeier, M, and I Schnabel (2016), “Bubbles and central banks: Historical perspectives”, in M Bordo, Ø Eitrheim, M Flandreau, and J Qvigstad (eds) Central Banks at a Crossroad: What Can We Learn from History?, Cambridge University Press: Cambridge.
Di Maggio, M, and A Kermani (2017), “Credit-induced boom and bust”, Review of Financial Studies 30, 3711-3758.
Favara, G, and J Imbs (2015), “Credit supply and the price of housing”, American Economic Review, 105, 958-92.
Fischer, I (1933), “The debt-deflation theory of great depressions”, Econometrica 1, 337-357.
Galbraith, J (1955), “The great crash 1929”, Houghton Miffin Harcourt.
Geanakoplos, J (2010), “The leverage cycle”, NBER macroeconomics annual 24, 1-66.
Hong, H, J D Kubik, and T Fishman (2012), “Do arbitrageurs amplify economic shocks?”, Journal of Financial Economics 103, 454-470.
Jorda, O, M Schularick, and A Taylor (2015), “Leveraged bubbles”, Journal of Monetary Economics 76, 1-20.
Kindleberger, C (1978), Manias, Panics, and Crashes: A History of Financial Crises, Wiley: New York.
Lamont, O, and J Stein (2004), “Aggregate short interest and market valuations”, American Economic Review Papers and Proceedings 94, 29-32.
Mian, A, and A Sufi (2009), “The consequences of mortgage credit expansion: Evidence from the US mortgage default crisis”, Quarterly Journal of Economics 124, 1449-1496.
Simsek, A (2013), “Belief disagreement and collateral constraints”, Econometrica 91, 1-53.
Temin, P, and H-J Voth (2004), “Riding the South Sea Bubble”, American Economic Review 94, 1654-1668.
Endnotes
1 E.g. https://www.bloomberg.com/opinion/articles/2015-10-20/low-interest-rates-are-here-to-stay and https://www.ft.com/content/84a1b13c-b2a3-11e9-8cb2-799a3a8cf37b.
2 Shortly before, the South Sea Company opens a similar facility. We collect loan information for both companies.
3 Temin and Voth (2004) report that in April 1720 interest rates on collateralized loans were 10% per month and became 1% per day thereafter.
4 The date of the peak value of the East India Company is 12th of June, whereas the 9th of June is the peak value of the Royal African Company. Results are not particularly sensitive to the choice of the peak value days. The sum of the percentages of columns 2 to 7 is larger than 79% because a trader could take more than one speculative position.


