Increasing returns to scale are at the core of many fundamental economic issues. Scale economies are a source of long-run growth and gains from trade, and a primary justification for industrial and anti-trust policy.1
But where do macroeconomic increasing returns to scale come from? An increase in the size of a market, say due to globalisation or migration, can improve productivity for two reasons. The first explanation is technological: if individual firms have increasing returns to scale – for example, due to fixed costs – then a larger market improves efficiency because those fixed costs will be spread over a larger quantity of units produced. The second explanation is allocative: an increase in market size intensifies competition, and more intense competition can reallocate resources in a way that improves aggregate efficiency.
Modern trade theory, since Krugman (1979), has recognised the importance of both forces. However, while the technological effect unambiguously improves efficiency, whether the allocative effect increases efficiency depends on whether increased competition alleviates or exacerbates pre-existing distortions (Helpman and Krugman 1985). In practice, this hinges on subtle properties of the shape of demand curves (Dhingra and Morrow 2019).
In a recent paper (Baqaee et al. 2021), we study aggregate returns to scale using a flexible model of demand with heterogeneous firms. We answer two questions. First, how much of the gains from an increase in market size are due to technical efficiency at the firm level, and how much is due to the reshuffling of resources induced by more intense competition? Second, what mechanism is responsible for gains from increased competition? Are those gains driven by falling markups, the exit of marginally profitable firms, or something else entirely?
We isolate a new mechanism, which we call the Darwinian effect, whereby an increase in market size improves efficiency and welfare regardless of the shape of demand. Quantitatively, we find that the Darwinian effect is far and away the most important driver of increasing aggregate returns to scale. One implication is that a policymaker can achieve some of these gains even in an economy with fixed resources by subsidising firm entry costs through tax incentives for new businesses.
The sources of gains from a market expansion
Consider an economy where producers have fixed entry and overhead costs, there is entry and exit, and monopolistic competition. When market size increases, because of technological economies of scale, consumer welfare rises even holding fixed the allocation of resources. We refer to this as a change in technical efficiency.
We refer to changes in welfare due to the reallocation of resources as changes in allocative efficiency. Improvements in allocative efficiency can be broken into three distinct channels: (1) the Darwinian effect, (2) the selection effect, and (3) the pro-competitive effect.
Darwinian effect
The Darwinian effect captures how firms with different price-elasticities are differentially affected by changes in the number of entrants. Each firm faces a demand curve, which pins down quantity as a function of the firm’s price relative to an aggregate market-level price index. When the market expands and new firms enter, the aggregate price index falls, intensifying competition for all firms. Firms with more inelastic demand, however, are relatively insulated from changes in the aggregate price index, and hence expand relative to firms with elastic demand.
Note that the markup of each firm is inversely related to its demand elasticity. Hence, the Darwinian effect reallocates resources from firms with elastic demand (and low markups) towards firms with inelastic demand (and high markups). From a social perspective, high-markup firms are too small relative to low-markup firms, and so this reallocation improves efficiency. We call this a Darwinian effect because a more competitive environment automatically selects and expands the ‘fittest’ firms (those with the most inelastic demand). Notably, this effect exists and is welfare-increasing regardless of the shape of demand curves, as long as there is non-trivial heterogeneity.
There are two other types of reallocations besides the Darwinian one. Unlike the Darwinian effect, these two effects, which have been studied in detail in previous work, have theoretically ambiguous effects on welfare.
Selection effect
The selection effect results from the fact that toughening competition can lead marginally profitable firms to exit the market. This effect, emphasised by Corcos et al. (2012), only exists in models with overhead costs of production, such as Melitz (2003). Importantly, the welfare impact of the selection effect is unclear: it depends on whether consumer surplus relative to sales generated by exiting firms is greater than or less than average.
Pro-competitive effect
The pro-competitive effect results from the fact that more intense competition causes firms to reduce their desired markups. Once again, the effect on consumer welfare is ambiguous. The direction of the effect depends on whether or not entry is initially excessive and on whether changes in markups diminish or exacerbate misallocation across firms.
Quantifying gains with firm-level data
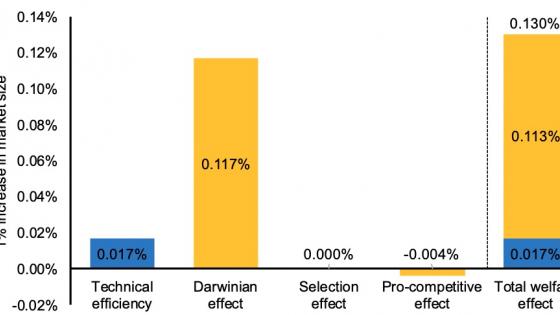
How important are each of the channels above? Figure 1 shows how welfare responds when we increase the size of the market by 1% in our quantitative model.2 Changes in technical efficiency are coloured blue, and changes in allocative efficiency are coloured yellow. Around 90% of the gains from increased scale come from allocative, rather than technical, efficiency. (We consider an array of calibrations in the paper, and the message is unchanged: allocative efficiency contributes the majority of gains.)
Moreover, the gains in allocative efficiency are not due to reductions in markups (pro-competitive effect) or the exit of unprofitable firms (selection effect). These channels actually mildly reduce, rather than increase, consumer welfare. Instead, the gains come exclusively from the Darwinian effect: tougher competition causes a beneficial reallocation from low-markup to high-markup firms.
Baqaee and Farhi (2020) show that this type of composition change – a reallocation from low-markup firms to high-markup firms – explains a significant fraction of aggregate productivity growth in the US over the last two decades. Autor et al. (2020) and De Loecker et al. (2020) document a similar reallocation of market share to high-markup firms over time. This analysis raises the possibility that increases in scale, perhaps driven by globalisation, could be responsible for these welfare-improving reallocations in the data.
Figure 1 Welfare effect of a 1% increase in market size, decomposed by channel
Note: The welfare gains from an increase in market size are decomposed into technical efficiency gains (blue), which arise from technological features of production, and allocative efficiency gains (yellow), which arise due to endogenous reallocations. The lion’s share of gains are due to the relative expansion of high-markup firms due to intensifying competition, which we call the Darwinian effect. These calculations are from Table 1, column 1 in Baqaee et al. 2021.
Policy implications
These same reallocations can also take place due to changes in policy. For example, a policymaker may want to encourage or restrict entry to affect the level of competition.
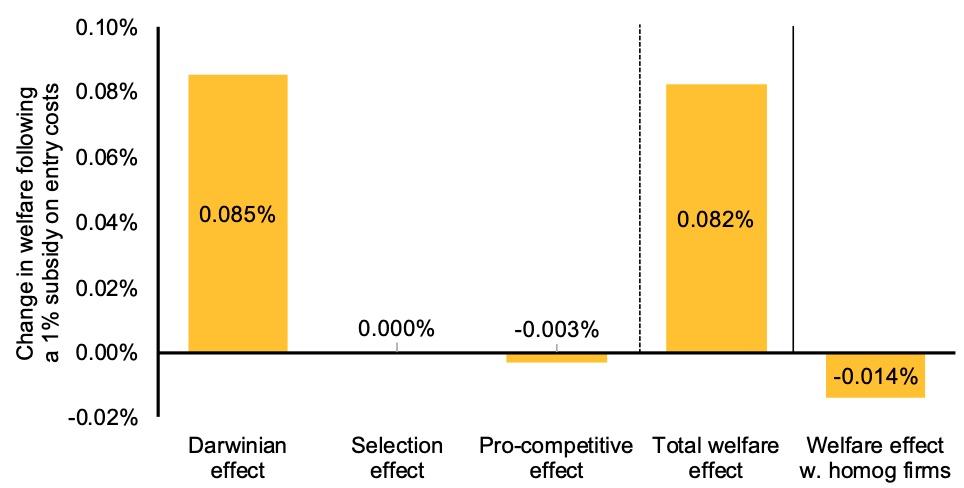
Figure 2 shows the welfare effect of subsidising the costs of starting a business by 1%. We find that this entry subsidy improves welfare even when there is too much entry relative to the first best. This is a consequence of the general theory of the second best (Lipsey and Lancaster 1956) – since all optimality conditions cannot be satisfied, the next-best solution involves changing other variables (like the amount of entry) away from the values that would otherwise be optimal. In our model, subsidising entry above the first-best level is desirable since entry triggers Darwinian reallocations that alleviate cross-sectional misallocation.
Figure 2 Welfare effect of 1% subsidy on entry costs
Note: The welfare impact of an entry subsidy is decomposed into the Darwinian effect, the selection effect, and the pro-competitive effect; the Darwinian effect constitutes the entirety of the gains. Ignoring firm heterogeneity would predict that an entry subsidy is harmful, rather than beneficial. These calculations are from Table 4, column 1 in Baqaee et al. (2021).
Conclusion
Our results suggest that reallocations can greatly magnify returns to scale at the aggregate level. The predominant channel for these gains is due to how increased entry alleviates existing misallocation across firms by reallocating resources from low-markup to high-markup firms. These beneficial reallocations boost the gains from increased market size, and policymakers can harness these forces by incentivising entry.
References
Amiti, M, O Itskhoki and K Konings (2019), “International Shocks, Variable Markups, and Domestic Prices”, The Review of Economic Studies 86(6): 2356-2402.
Autor, D, D Dorn, L F Katz, C Patterson and J Van Reenen (2020), “The Fall of the Labor Share and the Rise of Superstar Firms”, The Quarterly Journal of Economics 135(2): 645-709.
Baqaee, D R and E Farhi (2017), “Aggregate productivity and the rise of mark-ups”, VoxEU.org, 04 December.
Baqaee, D R and E Farhi (2020), “Productivity and Misallocation in General Equilibrium”, The Quarterly Journal of Economics 135(1): 105-163.
Baqaee, D R, E Farhi and K Sangani (2021), “The Darwinian Returns to Scale”, NBER Working Paper No. 27139.
Bartelme, D G, A Costinot, D Donaldson and A Rodriguez-Clare (2019), “The textbook case for industrial policy: Theory meets data”, NBER Working Paper No. 26193.
Basu, S and J G Fernald (1997), “Returns to scale in US Production: Estimates and Implications”, Journal of Political Economy 105(2): 249-283.
Corcos, G, M Del Gatto, G Mion and G Ottaviano (2012), “Productivity and firm selection: Quantifying the ‘new’ gains from trade”, VoxEU.org, 10 July.
De Loecker, J, J Eeckhout and G Unger (2020), “The rise of market power and the macroeconomic implications”, The Quarterly Journal of Economics 135(2): 561-644.
Dhingra, S and J Morrow (2019), “Monopolistic competition and optimum product diversity under firm heterogeneity”, Journal of Political Economy 127(1): 196-232.
Krugman, P R (1979), “Increasing returns, monopolistic competition, and international trade”, Journal of International Economics 9(4): 469-479.
Lipsey, R G and K Lancaster (1956), “The general theory of second best”, The Review of Economic Studies 24(1): 11-32.
Melitz, M J (2003), “The Impact of Trade on Intra-Industry Reallocations and Aggregate Industry Productivity”, Econometrica 71(6): 1695-1725.
Helpman, E and P R Krugman (1985), Market structure and foreign trade: Increasing returns, imperfect competition, and the international economy, MIT Press.
Endnotes
1 For evidence of aggregate increasing returns to scale, see for example Basu and Fernald (1997) and Bartelme et al. (2019).
2 Since we characterise these channels in terms of sufficient statistics that are measurable in the data, we can quantify the importance of each channel using empirical estimates of firm pass-through (we use estimates for Belgian manufacturing firms from Amiti et al. 2019). Our approach is non-parametric, allowing us to match observed sales and pass-through distributions exactly. Our calibration approach requires taking a stand on the average markup and the average ratio of consumer surplus to sales. In this column, we report quantitative results from our benchmark calibration which assumes that average markups and the average ratio of consumer surplus to sales is around 5%.


