There are huge disparities in the economic and social wellbeing of people across states within India and other South Asian countries (Subramanian 2011).1 This raises the question: Can government policies help the poor regions catch up with the rich ones?
Of the three classic responses, two rely on central government actions:
- Improve the business environment for the private sector, support market integration, improve connectivity, and ensure macroeconomic stability, or
- Intervene directly in sectors or locations in which the private sector is reluctant to invest.
An alternative strategy is to devolve power to local governments who may then implement policies more suited to local conditions. When it comes to economics there are three forms of decentralisation:
- Fiscal;
- Administrative; and
- Political.
In recent work (Iyer et al in Ghani 2010), we examine whether the current decentralisation arrangements in India are working to the benefit of the poor regions.
Fiscal decentralisation
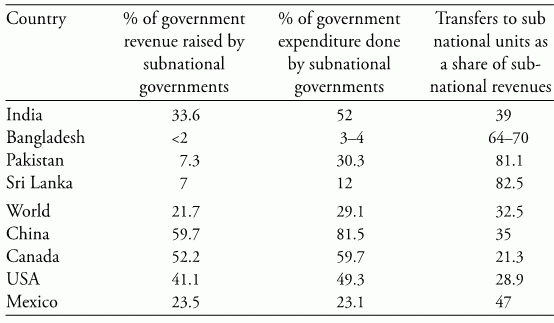
A typical cross-country measure of fiscal decentralisation is the share of total revenues or expenditures that are collected by sub-national governments. India is quite decentralised compared with the world average: sub-national (state and local) governments collect 34% of all government revenues and are in charge of 52% of total government expenditures (see Table 1).
Table 1. Extent of fiscal decentralisation in South Asia and the world
Sources: India, Canada, Mexico, and world figures are from Government Finance Statistics,GFS (1999); US and Mexico figures are from GFS; Sri Lanka figures from World Bank (2006) for 2004; World average is based on the 41 countries in the GFS database.
Like many large federal nations, states in India receive transfers from the central government through a variety of mechanisms. The first consists of tax shares and grants decided by a non-political Finance Commission, which places weights on factors such as the state’s area (10%), population (25%), per capita income (50%), and other factors including the state’s own revenues as a fraction of state domestic product (7.5%).
The second source of funding is from the Planning Commission, which is in charge of formulating national five-year plans and makes grants and loans for implementing state development plans. The Planning Commission takes into account the state population and the gap between state per capita income and national average, among other factors, when deciding the state-level allocations.
Third, various central government ministries give grants to their counterparts in the states for specified projects either wholly funded by the centre (central sector projects) or requiring the states to share a proportion of the cost (centrally sponsored schemes). These grants are wholly discretionary and often are not coordinated with Planning Commission transfers, although they are meant to serve similar objectives.
In addition to these explicit transfers from the central government to the states, a number of ‘hidden’ or ‘implicit’ transfers arise from the large subsidies given by the central government for food and fertiliser. In 2007–08, the central government had budgeted about 1.34% of overall GDP to be paid out in subsidies, the bulk of which paid for subsidised food sales through the Food Corporation of India, and for fertilisers. Additionally, subsidised borrowing resources for the states are provided by either the central government or government-owned financial institutions.
Figure 1 shows these different components of the transfers from the central to the state governments in India, as of 2006–07. We see that the largest component of fiscal transfers in India comes from the tax-sharing schemes, but the discretionary transfers and the subsidies put together are almost as large as the tax shares.
Figure 1. Transfers from central to state governments in India, 2006–07 (Rs billions)
We find that poorer states do receive higher per capita fiscal transfers in India. Figure 2 shows the relationship between total fiscal transfers received per capita in 2005–06 against the per capita state domestic product, for the major states of India. We see a significant negative slope, showing that richer states are given substantially lower fiscal transfers. Figure 2a includes only the explicit transfers – that is, those given through tax shares, state plan schemes, and other developmental and non-developmental funding. The picture looks quite similar when we include the food and fertiliser subsidies in addition to the explicit transfers (see Figure 2b).
Figure 2. Lagging regions and fiscal transfers in India, 2005–06
Sources: Government of India 2008; budget data for individual states for data on subsidies.
Note: GDP per capita is in constant 1999–2000 local currency units.
Looking at the different components of fiscal transfers in India, it becomes clear that the horizontal equity is being achieved only through the tax-sharing schemes of the Finance Commission (see Figure 3a), which show a strong inverse correlation with state per capita GDP. This is not surprising, given that per capita income carries a 50% weight in the allocation criteria for these transfers. In this sense, the biggest component of interstate fiscal transfers in India is strongly pro-poor.
However, the same cannot be said of the other components of fiscal transfers. The state plan grants administered by the Planning Commission are not directed toward either the richer or the poorer states, despite state income being one of the criteria to be considered (see Figure 3b). Potentially, this might arise because states have to propose specific plans for approval to the Planning Commission and poorer states may be lagging behind in producing viable development plans. On the other hand, funding for discretionary schemes by individual ministries shows significantly higher per capita expenditures in the richer states (see Figure 3c).
Assessing the spatial incidence of subsidies involves making some assumptions. If we assume that all the subsidies are spent in subsidising sales of food by the Food Corporation of India, then food subsidies per capita are roughly uniform across poor and rich states, (see Figure 3d). On the other hand, if we allocate food subsidies on the assumption that all the subsidies are spent in food procurement through above-market procurement prices, then we see that highest levels of subsidies are given to the rich states of Punjab, Haryana, and Maharashtra (see Figure 3e). The true picture is probably a mix of production and consumption subsidies, but the overall conclusion is that these food subsidies are not significantly higher in poorer regions. If we look at the second-biggest source of subsidies, fertiliser, we see that this benefits richer regions much more than poorer regions, because the richer regions tend to consume more fertiliser (see Figure 3f). In this sense, if the subsidies are meant to improve investment levels in lagging regions, they need to be targeted to those regions, rather than to a specific good or service that may turn out to be consumed more in richer states.
Figure 3. Lagging regions and types of fiscal transfers in India, 2005–06


Sources: Government of India; budget data for individual states. State-level subsidy allocation is estimated using food grain purchases or sales reported in annual reports published by the Food Corporation of India, 2005–06.
Administrative and political decentralisation
We find that the extent of administrative decentralisation varies across the types of services even within specific countries. There is also considerable variation in whether execution and supervision are both decentralised. For instance, India has devolved the execution of most education programmes to the sub-national level, but supervision in many cases is retained at the national level. Overall, as in fiscal decentralisation, we observe that India is more decentralised than the world average.
Does greater administrative decentralisation lead to better service delivery outcomes? We expect the effect to be ambiguous because we do not know whether the advantages of better local information and monitoring will or will not be offset by a greater degree of capture or corruption. Furthermore, the relative effects of these forces will depend both on local conditions, as well as on the nature of the service being decentralised.
In the cross-country data, we do not find any consistent relationship between the degree of administrative decentralisation and human capital investments (which reflect the effectiveness of public service delivery). The extent of administrative decentralisation is positively correlated with education attainment, but it is not correlated with infant mortality rates. Within India, we see that poorer states spend considerably less on social services, including education and health.
India has significantly increased the extent of political decentralisation through the 1993 Panchayati Raj Act, which required all states to set up a three-tier system of elected local governments at district, block, and village levels. As with administrative decentralisation, the cross-country data do not show any strong correlations between measures of political decentralisation and the quality of public service delivery.
Conclusion
We find that India is relatively decentralised in terms of fiscal, administrative, and political decentralisation, compared to other South Asian countries. We draw four conclusions.
- The systems of interstate fiscal transfers in India transfer a greater amount of resources to poorer regions, suggesting that they are acting in the direction of achieving greater equity. But this holds mostly when such pro-poor redistribution has explicit rules, and is not the case with all forms of interstate fiscal transfers.
- Some transfers from the central government to sub-national governments tend to be skewed toward richer states, the most illustrative examples being India’s discretionary schemes and fertiliser subsidies.
- Simply directing financial resources to poor regions may not be sufficient and will need to be complemented with increases in capacity, accountability, and participation at the local level, so that poor regions can make full use of these resources.
- Interstate transfers would benefit from more explicit rules and greater transparency.
A related question is whether fiscal transfers are the right way to help poor regions. After all, one can make the case that the presence of an interstate transfer system provides a disincentive for fiscal responsibility by sub-national governments, since they can always ask for transfers to compensate for budgetary shortfalls.
The views expressed here are those of the authors and not necessarily those of the World Bank or any other institution.
References
Ahluwalia, M (2000), “Economic performance of states in the post reforms period”, Economic and Political Weekly, 1637-1648.
Bardhan, Pranab (2002), “Decentralization of Governance and Development”, Journal of Economic Perspectives, 16(4):185-205.
Bardhan, Pranab, and Dilip Mookherjee (2006a), “Decentralization and Accountability in Infrastructure Delivery in Developing Countries”, Economic Journal, 116(1):101-127.
Besley, Timothy, and Anne Case (1995), “Incumbent Behavior: Vote-Seeking, Tax-Setting and Yardstick Competition”, American Economic Review, 85(1):25-45.
Chaudhury, Nazmul, Jeffrey Hammer, Michael Kremer, Karthik Muralidharan, and F. Halsey Rogers (2006), “Missing in Action: Teacher and Health Worker Absence in Developing Countries”, Journal of Economic Perspectives, 20(1):91-116.
Galasso, E and M Ravallion (2005), “Decentralized Targeting of an Anti-Poverty Program”, Journal of Public Economics, 89:705-727.
Galiani, Sebastian, Paul Gertler, and Ernesto Schargrodsky (2008), “School Decentralization: Helping the Good Get Better, But Leaving the Poor Behind”, Journal of Public Economics, 92:2106-2120.
Government of India (2008), The State of Panchayats 2007-08: An Independent Assessment. New Delhi: Ministry of Panchayati Raj, Government of India.
Iyer, Lakshmi, Ejaz Ghani, Saurabh Mishra (2010), “Is Decentralization Helping The Lagging Regions?”, in E Ghani (ed.), The Poor Half Billion, Oxford University Press.
Rao, M Govinda, and Nirvikar Singh (2005), Political Economy of Federalism in India. New Delhi: Oxford University Press.
Seabright, Paul (1996), “Accountability and Decentralization in Government: An Incomplete Contracts Model”, European Economic Review, 40(1):61-89.
Subramanian, A (2011), “
India’s Growth in the 2000s: Four Facts”, VoxEU.org, 5 December.
Lopez, Humberto and Luis Serven (2009), “Too Poor to Grow”, World Bank Policy Research Working Paper 5012.
World Bank (2008), “Qualitative Decentralization Indicators”, World Bank.
[1] Also see Ahluwalia 2000, Kochhar et al 2006 and Ghani 2010.


