While many studies have documented the wide disparity in income between whites on the one hand and African-Americans and Hispanics on the other, the gap in wealth is even greater. In seminal work on the subject, Oliver and Shapiro (1995) document and analyse the sources of the wealth differences between blacks and whites and discuss some of the deleterious effects of low wealth on the wellbeing of black families – including access to decent housing and education, poor health, lower longevity, and the like.
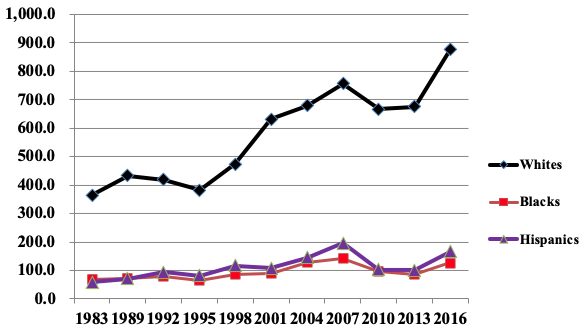
The racial disparity in standard wealth holdings in the US, after fluctuating over the years 1983 to 2007, was almost exactly the same in 2007 as in 1983 – with a ratio of mean wealth between the two groups of 0.19 (see Wolff 2017 and 2018 for more details). Median net worth among black as well as Hispanic households was close to zero over the whole time period, as were the ratios of median wealth between minority and white households. However, the Great Recession from 2007 to 2010 hit African-American households much harder than whites, and the ratio of mean wealth between the two groups plunged from 0.19 in 2007 to 0.14 in 2010 (see Figure 1). Indeed, the mean wealth of black households suffered a 33% decline in real terms (see Figure 2). White wealth, in contrast, declined by 12%. The relative (and absolute) losses suffered by black households from 2007 to 2010 are to a large extent ascribable to the fact that blacks had a higher share of homes in their portfolio than did whites and a much higher debt-net worth ratio (0.55 versus 0.15). These factors led to a wide disparity in annual real rates of return on their respective portfolios (-9.92 versus -7.07%). Between 2010 and 2016 there was no change in the racial wealth gap.
Figure 1 Ratio of mean net worth by race and ethnicity, 1983-2016
Figure 2 Mean net worth by race and ethnicity, 1983-2016 (1000s of 2016 dollars)
Hispanic households made sizeable gains on whites from 1983 to 2007. The ratio of standard mean net worth grew from 0.16 to 0.26, the Hispanic homeownership rate climbed from 33 to 49%, and the ratio of homeownership rates with white households advanced from 48 to 66%. However, in a reversal of fortunes, Hispanic households got hammered in the years 2007 to 2010, with their mean net worth plunging in half, the wealth ratio falling from 0.26 to 0.15, their homeownership rate down by 1.9%, and their net home equity plummeting by 47%. The relative (and absolute) losses suffered by Hispanic households over these three years were also mainly due to the much larger share of homes in their wealth portfolio and their much higher leverage (a debt-net worth ratio of 0.51 versus 0.15). These factors led to a large difference in real returns over the years 2007 to 2010 (-10.76 versus -7.07% per year). Unlike black households, there was a rebound in Hispanic wealth from 2010 to 2016 and the ethnic wealth ratio went up from 0.15 to 0.19, though still well below its 2007 peak.
Differential leverage and the resulting differences in rates of return on net worth played major roles in accounting for the relative collapse of the wealth of minorities over the Great Recession. The high positive rate of return among black households explained about three quarters of the advance of their wealth from 2001 to 2007, while the negative return accounted for 78% of the ensuing collapse from 2007 to 2010. Among Hispanics, it accounted for 59% of the gain in the first period and 57% of the drop in the second. Racial differentials in returns accounted for 43% of the relative wealth gain of black households from 2001 to 2007 and 39% of decline from 2007 to 2010. Disparities in returns played a somewhat smaller role in explaining changes in the ratio of mean wealth between Hispanics and whites. Over the years 2001 to 2007, they accounted for 33% of the relative wealth gain and over the years 2007 to 2010 for 28% of the relative drop-off.
The standard definition of wealth (net worth) includes marketable assets such as housing and other real estate, bank deposits and money market accounts, securities, corporate stock and mutual funds, defined contribution (DC) pension plans, including IRAs and 401(k)s, and unincorporated businesses. What if we now include Social Security wealth and defined benefit (DB) pension wealth to obtain a broader measure of wealth? Augmented wealth is defined as the sum of conventional net worth, DB pension wealth, and Social Security wealth. DB pension wealth is defined as the present value of the discounted stream of future DB pension benefits and Social Security wealth in analogous fashion is the present value of the discounted stream of future Social Security pension benefits. When the definition of wealth is so expanded, the wealth gap markedly shrinks.
There was a profound alteration of the private pension system after 1989, with a dramatic rise in DC pensions and a corresponding decline in DB pensions. However, the take-up rate in DC coverage was much greater for whites than the two minorities, with the share of households with DC plans climbing from 26% in 1989 to 60% in 2016 among whites, from 16 to 34% among blacks, and from 13 to 31% among Hispanics. The percentage with DB pensions declined for all three groups. All in all, the proportion holding any pension wealth went up from 62 to 72% among whites, from 40 to 50% among blacks, and from 31 to 40% among Hispanics.
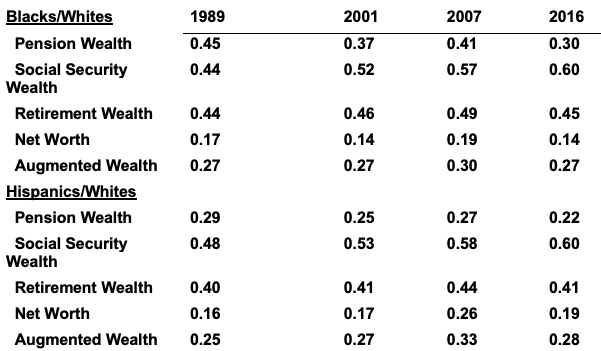
In 2016, there still remained sizeable gaps in retirement wealth (the sum of pension and Social Security wealth) and augmented wealth between minorities and whites, though these gaps were considerably smaller than those in standard net worth. The ratio of pension wealth (the sum of DC and DB pension wealth) of African-Americans to whites was 0.3 (see Table 1). This difference largely reflects disparities in pension holdings. The gap in Social Security wealth was much smaller – a ratio of 0.6. Overall the retirement wealth of the former was 45% that of the latter. Over time, the black-white ratio of pension wealth went more or less steadily downhill, from 0.45 in 1989 to 0.3 in 2016, while the ratio of Social Security wealth went uphill, from 0.44 to 0.6. As a result, the racial gap in retirement wealth was about the same in 2016 as in 1989. The ratio of pension wealth between Hispanics and whites was 0.22 in 2016. The ethnic discrepancy in Social Security wealth was about the same as the racial difference, as was the gap in retirement wealth. Almost in parallel to the racial discrepancies, the Hispanic-white differential in pension wealth enlarged, that in Social Security wealth narrowed, and the ratio in retirement wealth was about equal in 2016 and 1989.
Table 1 Ratio of mean retirement and augmented wealth, by race and ethnicity, 1989-2016
Source: Author's computations from the 1989, 2001, 2007, and 2016 SCF.
The most notable finding is the ratio of augmented wealth between blacks and whites was 0.27 in 2016, about double the ratio in standard net worth. While the black-white ratio of mean net worth declined between 1989 and 2016, the ratio of augmented wealth was about the same in the two years. Social Security made the difference, since the ratio of mean net worth plus DB pensions between the two fell from 0.22 to 0.18. Likewise, the ratio of augmented wealth between Hispanics and whites was greater than that of net worth – 0.28 versus 0.19 in 2016. The ethnic ratio of augmented wealth was a bit higher in 2016 than in 1989, as was the ratio of net worth.
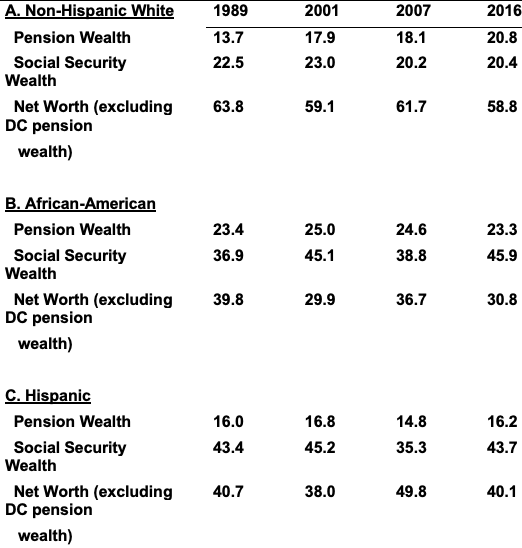
The main reason for the lower wealth gap in augmented wealth than net worth between minorities and whites is that the portfolio composition of augmented wealth was much more heavily tilted toward Social Security among the former. In 2016, Social Security wealth comprised 46% of the augmented wealth of blacks and 44% among Hispanics, compared to 20% among whites (see Table 2). Pension wealth made up 23% among African-Americans, compared to 21% among whites and 16% among Hispanics. Correspondingly, net worth (excluding DC pensions) was more important for whites, accounting for 59% of their total wealth, compared to 31% among blacks and 40% among Hispanics. Over time, pension wealth (particularly DC wealth) rose in importance for whites but remained more or less constant for blacks and Hispanics. Social Security wealth, in contrast, rose as a share of total wealth for blacks, remained constant among Hispanics, but fell among whites.
Table 2 Portfolio composition by race and ethnicity, 1989-2016 (percentage of augmented wealth)
Source: Author's computations from the 1989, 2001, 2007, and 2016 SCF.
This study highlights the importance of Social Security in the minority community. In 2016, Social Security made up a much greater share of total (augmented) wealth of minorities than of whites. On a policy note, efforts to curtail Social Security payouts will have a much more deleterious effect on the finances of the two minority groups than among whites.
References
Oliver, M L, and T M Shapiro (1995), Black Wealth/White Wealth: A New Perspective on Racial Inequality, Routledge.
Wolff, E N (2017), A Century of Wealth in America, Harvard University Press.
Wolff, E N (2018), “The Decline of African-American and Hispanic Wealth since the Great Recession,” NBER Working Paper No. 25198.


