On 17 October 2016 the Eurozone member states submitted to the European Commission their Draft Budgetary Plan for 2017. The Commission is evaluating member states’ compliance with the Stability and Growth Pact (SGP) and consistency with convergence toward the Medium-Term Objective as agreed last Spring. For a handful of countries (including Belgium, Spain, Italy, Portugal, and Finland), the Commission requested further clarification, because there is a difference between its evaluation and member states’ and evaluations of structural balance and cyclical position, or because of a difference from what was planned in the Stability Programme in May. Italy presented a 2017 Draft Budgetary Plan that implied a worsening in the structural balance not in line with the Council recommendations of 15 June. The government explains that part of the difference is caused by additional spending due to the emergency of migration flows and the need to increase the anti-seismic resistance of public and private buildings in large areas of the country following the dramatic consequences of the recent earthquake that hit the centre of Italy. The government has also expressed reservations about the results of the agreed methodology to compute the output gap and presented possible alternatives that, in line with the doubts that will be highlighted in this article, would indicate higher potential output and thus a worse cyclical position of the Italian economy.
Since the 2005 SGP reform, structural balance has had a key role in the evaluation of member states’ compliance with the preventive arm of the SGP. Central to estimating the structural balance is the estimation of the cyclical position of a country. This is determined by estimating the output gap. Some variables used in this measurement are not observable. This is the case for potential output which, to be calculated, needs some estimates of productivity (total factor), capital, and potential employment. The latter is indirectly obtained by the Commission by estimating the non-accelerating wage rate of unemployment (NAWRU) using unobservable component models. We focus our contribution on the latter methodology, highlighting its failure to capture the information provided by the data and, as a consequence, its misleading role in identifying the cyclical position of a country, and how this subsequently affects the recommendations the Council of the European Union makes to member states to restore compliance with the SGP. What seems to be a technical aspect of little relevance for everyday life is in fact crucial.
The cyclicality of the Commission’s NAWRU in some countries has already been discussed on this site (Cottarelli 2015, among others). Fioramanti (2016) shows that, in the case of Italy, the NAWRU estimates are very sensitive to the forecast horizon, technical aspects of the software used, and certain restrictions imposed on the stochastic processes adopted in the estimation of unobservable components. What we want to further stress here is the arbitrariness of these restrictions and the limited informative role of the Phillips curve as specified in the actual procedure implemented by the Commission.
Phillips curves can be estimated with two specifications. The accelerationist Phillips curve is a relationship between the change in wage inflation, cyclical unemployment and (possibly) other variables. The traditional Phillips curve is a relationship between wage inflation, cyclical unemployment, some measure of expected inflation and possibly other variables.
In estimating the NAWRU, the Commission uses an accelerationist specification for all the 28 member states to augment a trend-cycle decomposition obtained using a bivariate Kalman filter in an unobservable component model.[1] This methodology has produced a very poor fit of the Phillips curve, and this lack of explanatory power has worsened since the beginning of the Great Recession. In addition, over this period, the NAWRU has shown marked cyclicality. From now on, we will concentrate on results obtained for the 15 older member states.
For these members, in the Spring Forecast 2016, the R-squared statistic of the Phillips curve is less than 0.2 for eight countries (Germany, Denmark, Greece, Ireland, Italy, Portugal, Sweden, the UK), slightly above 0.2 for three countries (Belgium, Spain, Finland), slightly above 0.5 for two countries (Luxembourg, the Netherlands) and around 0.7 for the remaining two countries (Austria, France). In general, the Commission has different specifications of the Phillips curve for different countries: the number of lags in cyclical unemployment can vary (from 0 to 2), the number of exogenous variable can vary, and a backward or forward looking Phillips curve can be specified.[2] Nonetheless, in most of the specifications the coefficient(s) on cyclical unemployment in the Phillips curve are not significant.
To get an overview of this issue, we run a large set of OLS regressions for the old 15 member states using the traditional and accelerationist specifications of the Phillips curve.3
Can we see a pattern?
For each country, we run six regressions using both the traditional and accelerationist specifications, with two, one or zero lags of cyclical unemployment. For all traditional curves we tested the hypothesis that the coefficient on lagged wage inflation is equal to one, and for all specifications we tested the hypothesis that the sum of coefficients on cyclical unemployment is equal to zero. The first can be interpreted both as a test of traditional versus accelerationist models, and a test of anchored expectations; the second as a test of the significance of cyclical unemployment in explaining inflation.
The main results of the regressions are the following:
- The second test rejects in only one of 45 accelerationist regressions (for Belgium), suggesting little or no significance of cyclical unemployment.
- The first test rejects the null in 18 out of 45 traditional regressions, suggesting anchored inflation expectations. Together with point one this reinforces the view that it would be better to use a traditional instead of accelerationist model to estimate the equilibrium unemployment rate.
- The null that the sum of the parameters is equal to zero is only rejected in one out of 45 traditional specifications. Together with point one this suggests the very weak information content of the accelerationist Phillips curve in the Commission methodology.
- The traditional Phillips curve specification always has a better fit in terms of (adjusted) R-squared than the accelerationist curve – in general above 0.80 for traditional and below 0.50 for accelerationist.
With these results we are not claiming to have more robust models, but our results cast serious doubts over the validity of the Commission models. These doubts will be reinforced by the following section.
Excess sensitivity of the estimates
The Commission’s NAWRU procedure allows constraints to be imposed on the upper and lower bounds of allowed variances of disturbance terms of the stochastic processes (more details in Fioramanti 2016). Depending on these bounds, a member state’s NAWRU can be ‘estimated’ to be anything from a deterministic trend to the unemployment rate.
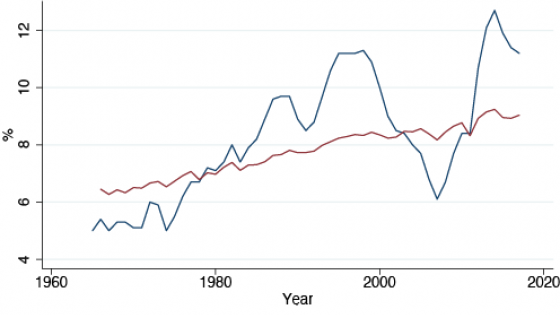
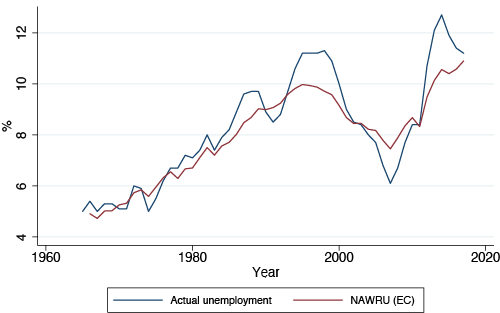
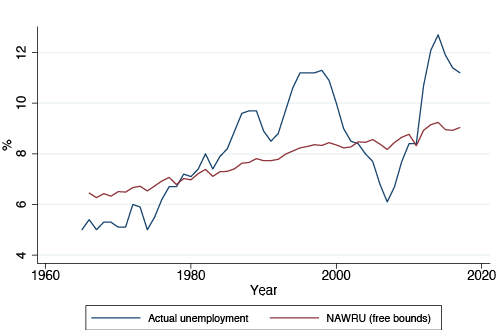
As an example, Figures 1 and 2 show the official NAWRU estimated for Italy by the Commission and the one obtained relaxing those constraints.
Figure 1. Italy: Actual unemployment and NAWRU, European Commission baseline
Figure 2. Italy: Actual unemployment and NAWRU, no variance bounds
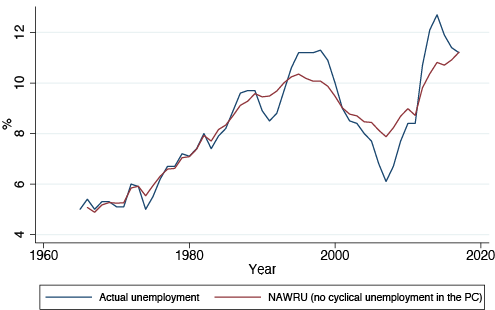
As can be seen, relaxing the constraints produces very different results. To reinforce the view of the major role of the bounds versus the data, Figure 3 reports the NAWRU obtained leaving the Commission’s constraints as they are in their estimates, but removing cyclical unemployment from the equation with the acceleration of inflation as a dependent variable. Comparing Figure 3 with Figure 1, the difference in NAWRU is very small. This supports the view that the shape of the NAWRU is given by cherry-picking the variances’ bounds and that, in this case, the informative content of the accelerationist Phillips curve is negligible.
Figure 3. Italy: Actual unemployment and NAWRU, no cyclical unemployment regressors
This exercise has been replicated for all the 15 old member states. To summarise the results, relaxing the constraints on the variances has no or only minor effects on just two countries (Germany and Greece), while for the others it has major effects. Conversely, removing cyclical unemployment from the acceleration of inflation equation has small or no effects for nine countries, but produces important changes for six countries (Belgium, France, Ireland, Portgual, Sweden and Germany).
Can we do better?
Given the high sensitivity of the NAWRU to even small changes in the constraints, we ask if there is a better way to assess the equilibrium unemployment rate. Unfortunately, there are no methodologies that are unequivocally recognised as better. Some attempts can be made, incorporating, for example, long term unemployment and structural elements of the labour market. This research agenda could take into account elements such as hysteresis and labour market rigidities, reducing the volatility/cyclicality of the NAWRU as in, for example, Rusticelli (2015) and Lendvai et al (2015). Lendvai et al (2015) suggest the use of structural unemployment instead of the NAWRU. In the case of Italy, for example, the latest Commission estimate of structural unemployment is 8.9% (European Commission 2014), which is 1.7 percentage points less than the 2014 NAWRU estimate. By a heuristic rule of one third, this implies a structural balance 0.6 percentage points more favourable, implying that Italy was very close to its medium term objectives in 2014.
Conclusions
The difference in the structural balance calculated by the European Commission and the Italian authority can easily be produced by tweaking the second or third decimal point of variance bounds imposed on the stochastic processes driving the NAWRU. Do we really want these technical aspects of an estimation procedure – the uncertainty of which is huge and cannot be removed given the unobservability of the underlying phenomenon – to be the key element on which we base our decision on Italy’s fiscal strategy in a time when a still high unemployment rate and humanitarian emergencies require the support of government’s actions?
Authors’ note: The opinions expressed in this column are those of the authors and do not necessarily reflect the view of their respective Institutions.
References
Cottarelli, C (2015) “Potential growth rates and the working of SGP fiscal rules”, VoxEU.org, 2 March.
European Commission (2014) “The revised methodology for calculating output gaps”, in European Economy –European Economic Forecast, N.3 Spring.
Fioramanti, M (2016) “Potential output, output gap and fiscal stance: Is the EC estimation of the NAWRU too sensitive to be reliable?”, MPRA repository, N 73762.
Havik, K, K Mc Morrow, F Orlandi, C Planas, R Raciborski, W Roeger, A Rossi, A Thum-Thysen and V Vandermeulen (2014) “The production function methodology for calculating potential growth rates & output gaps”, European Economy, Economic Paper N 535.
Lendvai, J, M Salto and A Thum-Thysen (2015) “Structural unemployment vs NAWRU: Implications for the assessment of the cyclical position and the fiscal stance”, N 552.
Planas, C and A Rossi (2015) “Program GAP: Technical description and user manual”, JRC Scientific and Technical report, May, version 4.4.
Rusticelli, E (2015) “Rescuing the Phillips curve: Making use of long-term unemployment in the measurement of the NAIRU”, OECD Journal: Economic Studies, V 2015.
Endnotes
[1] For details on the methodology and the possible variables and models available, see Havik et al (2015) and Planas and Rossi (2015).
[2] For an explanation of the differences between the two definition see European Commission (2014).
[3] In the traditional Phillips curve, wage inflation is regressed on its lag, change in labour productivity, change in wage share, change in term of trade, and lags of cyclical unemployment (from 0 to 2) where this is defined by the difference between actual unemployment and the Commission’s estimate of the NAWRU. For the accelerationist curve we used the same regressors, but lagged wage inflation.


